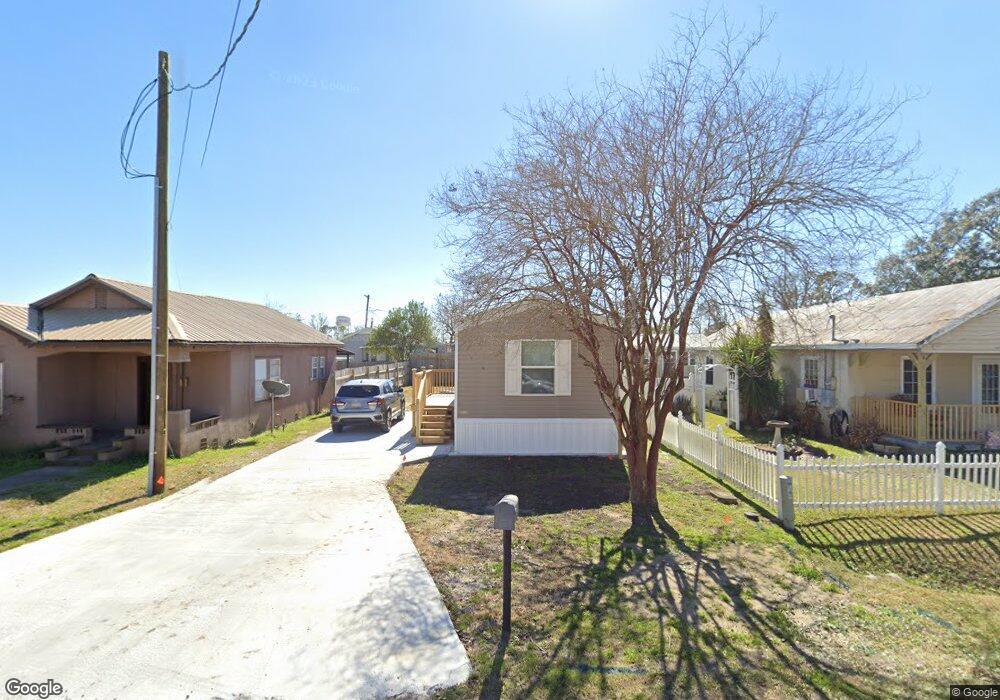
509 Pine St Thibodaux, LA 70301
Estimated Value: $132,000 - $207,000
2
Beds
2
Baths
971
Sq Ft
$165/Sq Ft
Est. Value
About This Home
This home is located at 509 Pine St, Thibodaux, LA 70301 and is currently estimated at $160,052, approximately $164 per square foot. 509 Pine St is a home located in Lafourche Parish with nearby schools including C.M. Washington Elementary School, West Thibodaux Middle School, and Thibodaux High School.
Ownership History
Date
Name
Owned For
Owner Type
Purchase Details
Closed on
Feb 26, 2025
Sold by
Landrum Tara Avonlea
Bought by
Trant Mark James
Current Estimated Value
Home Financials for this Owner
Home Financials are based on the most recent Mortgage that was taken out on this home.
Original Mortgage
$108,000
Outstanding Balance
$107,465
Interest Rate
7.04%
Mortgage Type
New Conventional
Estimated Equity
$52,587
Purchase Details
Closed on
May 26, 2023
Sold by
Hoffman Nathan Joseph and Shelby Jane
Bought by
Trant Mark James and Landrum Tara Avonlea
Home Financials for this Owner
Home Financials are based on the most recent Mortgage that was taken out on this home.
Original Mortgage
$119,000
Interest Rate
6.27%
Mortgage Type
New Conventional
Purchase Details
Closed on
Jan 31, 2013
Sold by
Landry Lorraine Gros and Landry Donald J
Bought by
Boudreaux Theresa Lirette and Boudreaux Ernest A
Create a Home Valuation Report for This Property
The Home Valuation Report is an in-depth analysis detailing your home's value as well as a comparison with similar homes in the area
Home Values in the Area
Average Home Value in this Area
Purchase History
| Date | Buyer | Sale Price | Title Company |
|---|---|---|---|
| Trant Mark James | -- | None Listed On Document | |
| Trant Mark James | $164,000 | None Listed On Document | |
| Boudreaux Theresa Lirette | $18,000 | None Available |
Source: Public Records
Mortgage History
| Date | Status | Borrower | Loan Amount |
|---|---|---|---|
| Open | Trant Mark James | $108,000 | |
| Previous Owner | Trant Mark James | $119,000 |
Source: Public Records
Tax History
| Year | Tax Paid | Tax Assessment Tax Assessment Total Assessment is a certain percentage of the fair market value that is determined by local assessors to be the total taxable value of land and additions on the property. | Land | Improvement |
|---|---|---|---|---|
| 2024 | $794 | $8,030 | $1,000 | $7,030 |
| 2023 | $767 | $7,790 | $1,000 | $6,790 |
| 2022 | $800 | $7,790 | $1,000 | $6,790 |
| 2021 | $772 | $7,790 | $1,000 | $6,790 |
| 2020 | $784 | $7,790 | $1,000 | $6,790 |
| 2019 | $900 | $9,510 | $510 | $9,000 |
| 2018 | $900 | $9,510 | $510 | $9,000 |
| 2017 | $1,034 | $9,510 | $510 | $9,000 |
| 2016 | $894 | $9,510 | $510 | $9,000 |
| 2015 | $935 | $9,900 | $0 | $0 |
| 2014 | $939 | $9,900 | $0 | $0 |
| 2013 | $939 | $9,900 | $0 | $0 |
Source: Public Records
Map
Nearby Homes
Your Personal Tour Guide
Ask me questions while you tour the home.