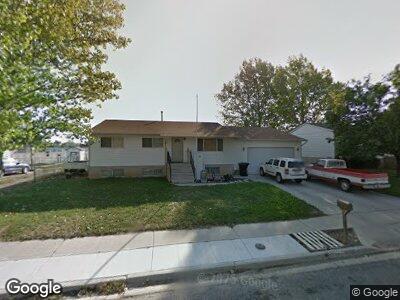
509 S 1000 W Payson, UT 84651
Estimated Value: $479,000 - $507,956
5
Beds
3
Baths
2,960
Sq Ft
$168/Sq Ft
Est. Value
About This Home
This home is located at 509 S 1000 W, Payson, UT 84651 and is currently estimated at $497,239, approximately $167 per square foot. 509 S 1000 W is a home located in Utah County with nearby schools including Wilson Elementary School, Mt. Nebo Junior High School, and Mt. Nebo Middle.
Ownership History
Date
Name
Owned For
Owner Type
Purchase Details
Closed on
Aug 31, 2017
Sold by
Arnold Russell and Arnold Sharon
Bought by
Windley Halie Marie and Windley Nathan Henley
Current Estimated Value
Home Financials for this Owner
Home Financials are based on the most recent Mortgage that was taken out on this home.
Original Mortgage
$9,814
Interest Rate
3.93%
Mortgage Type
Stand Alone Second
Create a Home Valuation Report for This Property
The Home Valuation Report is an in-depth analysis detailing your home's value as well as a comparison with similar homes in the area
Home Values in the Area
Average Home Value in this Area
Purchase History
| Date | Buyer | Sale Price | Title Company |
|---|---|---|---|
| Windley Halie Marie | -- | Synergy Title Ins Agency Ll |
Source: Public Records
Mortgage History
| Date | Status | Borrower | Loan Amount |
|---|---|---|---|
| Open | Windley Halie Marie | $254,375 | |
| Closed | Windley Halie Marie | $9,814 | |
| Closed | Windley Halie Marie | $245,372 |
Source: Public Records
Tax History Compared to Growth
Tax History
| Year | Tax Paid | Tax Assessment Tax Assessment Total Assessment is a certain percentage of the fair market value that is determined by local assessors to be the total taxable value of land and additions on the property. | Land | Improvement |
|---|---|---|---|---|
| 2024 | $2,282 | $232,265 | $0 | $0 |
| 2023 | $2,176 | $222,090 | $0 | $0 |
| 2022 | $2,270 | $227,865 | $0 | $0 |
| 2021 | $1,925 | $309,900 | $85,700 | $224,200 |
| 2020 | $1,827 | $287,800 | $77,900 | $209,900 |
| 2019 | $1,712 | $276,500 | $69,700 | $206,800 |
| 2018 | $1,556 | $242,100 | $62,300 | $179,800 |
| 2017 | $1,398 | $116,985 | $0 | $0 |
| 2016 | $1,358 | $112,915 | $0 | $0 |
| 2015 | $1,259 | $104,005 | $0 | $0 |
| 2014 | $1,241 | $103,235 | $0 | $0 |
Source: Public Records
Map
Nearby Homes