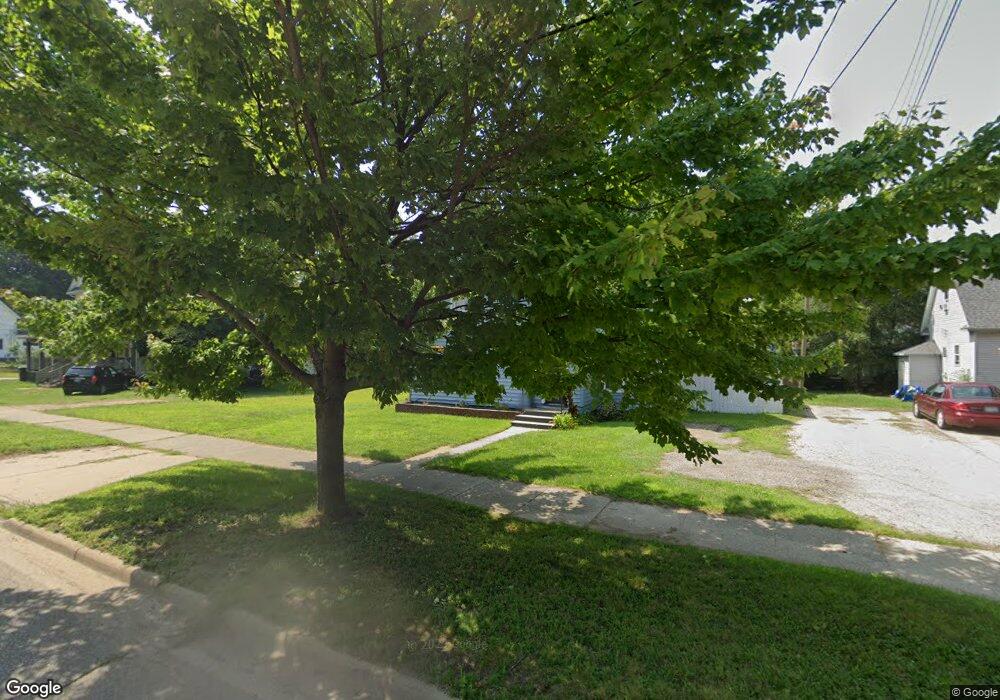
509 S Bridge St Belding, MI 48809
Estimated Value: $170,000 - $205,000
4
Beds
1
Bath
1,278
Sq Ft
$144/Sq Ft
Est. Value
About This Home
This home is located at 509 S Bridge St, Belding, MI 48809 and is currently estimated at $184,356, approximately $144 per square foot. 509 S Bridge St is a home located in Ionia County with nearby schools including Ellis Elementary School, Woodview Elementary School, and Belding Middle School.
Ownership History
Date
Name
Owned For
Owner Type
Purchase Details
Closed on
Feb 10, 2010
Sold by
Cole Brenda
Bought by
Jackson Donnie and Jackson Lorri
Current Estimated Value
Purchase Details
Closed on
Feb 9, 2010
Sold by
Independent Bank
Bought by
Cole Brenda L
Create a Home Valuation Report for This Property
The Home Valuation Report is an in-depth analysis detailing your home's value as well as a comparison with similar homes in the area
Home Values in the Area
Average Home Value in this Area
Purchase History
| Date | Buyer | Sale Price | Title Company |
|---|---|---|---|
| Jackson Donnie | $50,000 | -- | |
| Cole Brenda L | $18,000 | -- |
Source: Public Records
Tax History
| Year | Tax Paid | Tax Assessment Tax Assessment Total Assessment is a certain percentage of the fair market value that is determined by local assessors to be the total taxable value of land and additions on the property. | Land | Improvement |
|---|---|---|---|---|
| 2025 | $1,278 | $54,400 | $8,100 | $46,300 |
| 2024 | $12 | $54,400 | $8,100 | $46,300 |
| 2023 | $1,149 | $40,500 | $7,400 | $33,100 |
| 2022 | $1,094 | $40,500 | $7,400 | $33,100 |
| 2021 | $1,136 | $34,100 | $4,800 | $29,300 |
| 2020 | $1,060 | $34,100 | $4,800 | $29,300 |
| 2019 | $961 | $31,500 | $4,600 | $26,900 |
| 2018 | $1,111 | $27,100 | $5,300 | $21,800 |
| 2017 | $969 | $27,100 | $5,300 | $21,800 |
| 2016 | $961 | $23,100 | $3,300 | $19,800 |
| 2015 | -- | $23,100 | $3,300 | $19,800 |
| 2014 | $955 | $21,900 | $3,100 | $18,800 |
Source: Public Records
Map
Nearby Homes
- 107 W Center St
- 322 Alderman St
- 516 S Front St
- 917 S Bridge St
- 918 S Broas St
- 753 W State St
- 421 Lewis St
- 632 Edgewood St
- 740 Crawford St
- 208 Leonard St
- 216 Leonard St
- 749 Moulton St
- 129 Midway St
- 6961 Riverwood Dr
- 902 N York St
- 2160 W Ellis Parcel 6
- 2160 W Ellis Parcel 5
- 7620 Storey Rd
- 7762 Sierra Dr
- 2160 W Ellis Parcel 2
- 513 S Bridge St
- 503 S Bridge St
- 111 W Center St
- 519 S Bridge St
- 508 S Bridge St
- 516 S Bridge St
- 510 Pleasant St
- 514 Pleasant St
- 504 S Bridge St
- 504 Pleasant St
- 520 S Bridge St
- 522 Pleasant St
- 109 E Center St
- 603 S Bridge St
- 115 W Division St
- 416 S Bridge St
- 515 Alderman St
- 103 E Division St
- 121 W Division St
- 521 Alderman St
Your Personal Tour Guide
Ask me questions while you tour the home.