509 S Cherry St Effingham, IL 62401
Estimated Value: $98,000 - $313,000
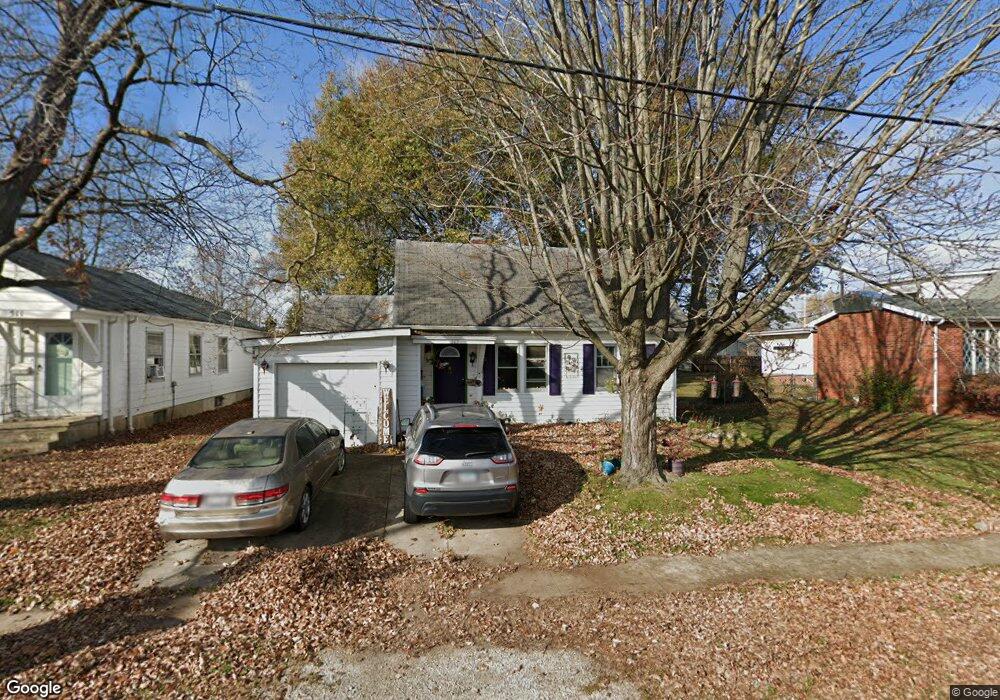
About This Home
This home is located at 509 S Cherry St, Effingham, IL 62401 and is currently estimated at $167,389, approximately $131 per square foot. 509 S Cherry St is a home located in Effingham County with nearby schools including South Side Grade School, Early Learning Center, and Central Grade School.
Ownership History
We collect this data history from publicly available records. To have your information removed, we recommend requesting removal directly through your county’s website.
Purchase Details
Home Financials for this Owner
Home Financials are based on the most recent Mortgage that was taken out on this home.Purchase Details
Home Values in the Area
Average Home Value in this Area
Purchase History
We collect this data history from publicly available records. To have your information removed, we recommend requesting removal directly through your county’s website.
| Date | Buyer | Sale Price | Title Company |
|---|---|---|---|
| $74,000 | None Available | ||
| $40,000 | None Available |
Mortgage History
We collect this data history from publicly available records. To have your information removed, we recommend requesting removal directly through your county’s website.
| Date | Status | Borrower | Loan Amount |
|---|---|---|---|
| Closed | $74,815 |
Tax History
We collect this data history from publicly available records. To have your information removed, we recommend requesting removal directly through your county’s website.
| Year | Tax Paid | Tax Assessment Tax Assessment Total Assessment is a certain percentage of the fair market value that is determined by local assessors to be the total taxable value of land and additions on the property. | Land | Improvement |
|---|---|---|---|---|
| 2024 | $1,586 | $29,470 | $10,660 | $18,810 |
| 2023 | $1,415 | $26,790 | $9,690 | $17,100 |
| 2022 | $1,302 | $24,580 | $8,890 | $15,690 |
| 2021 | $1,330 | $24,330 | $8,800 | $15,530 |
| 2020 | $1,293 | $23,640 | $8,550 | $15,090 |
| 2019 | $1,264 | $23,410 | $8,470 | $14,940 |
| 2018 | $1,207 | $22,510 | $8,140 | $14,370 |
| 2017 | $1,177 | $22,070 | $7,980 | $14,090 |
| 2016 | $1,140 | $21,430 | $7,750 | $13,680 |
| 2015 | -- | $20,800 | $7,520 | $13,280 |
| 2014 | -- | $20,190 | $7,300 | $12,890 |
| 2013 | -- | $19,800 | $7,160 | $12,640 |
| 2012 | -- | $19,500 | $7,050 | $12,450 |
Map
- 909 W Richland Ave
- 610 S Mulberry St
- 710 W Richland Ave
- 906 W Franklin Ave
- 509 South St
- 511 S 5th St
- 0 S Lakewood Dr
- 210 W Wabash Ave
- 405 S 4th St
- 201 W Lawrence Ave
- 302 N Main St
- 806 S 4th St
- 902 S 4th St
- 1616 Hillside Dr
- 513 Indiana Ave
- 1108 S 3rd St
- 510 Indiana Ave
- 510 N Merchant St
- 805 N Keller Dr
- 514 N 4th St
- 511 S Cherry St
- 601 S Cherry St
- 603 S Cherry St
- 505 S Cherry St
- 810 W Clinton Ave
- 811 W Clinton Ave
- 903 W Richland Ave
- 907 W Richland Ave
- 808 W Clinton Ave
- 809 W Clinton Ave
- 811 W Richland Ave
- 806 W Clinton Ave
- 807 W Clinton Ave
- 608 S Cherry St
- 809 W Richland Ave
- 804 W Clinton Ave
- 805 W Clinton Ave
- 610 S Cherry St
- 807 W Richland Ave
- 900 W Richland Ave
Ask me questions while you tour the home.