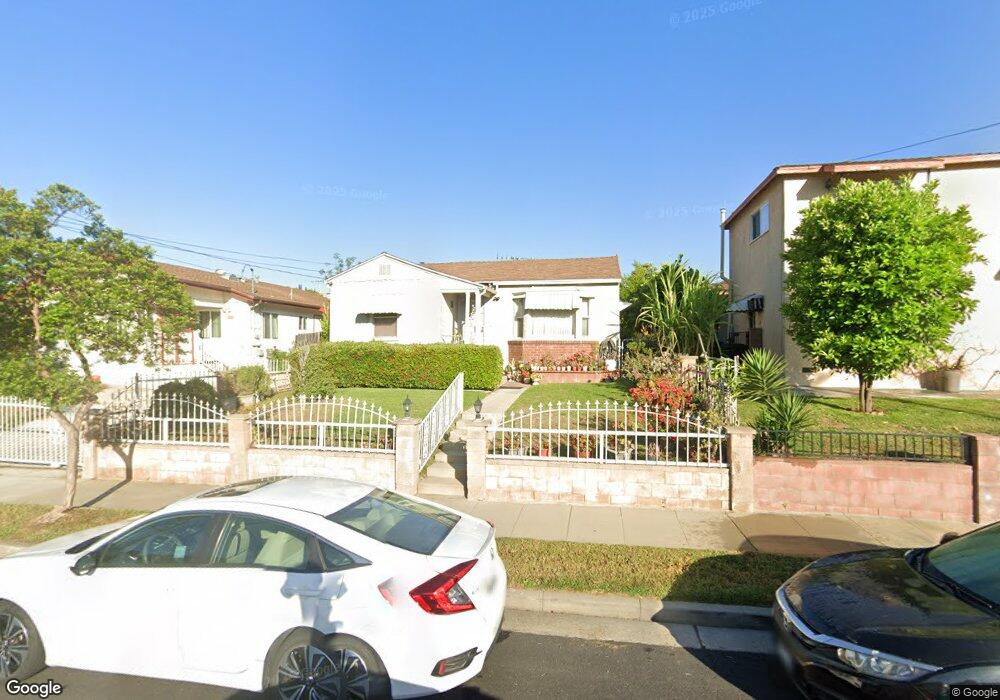
509 S Ynez Ave Monterey Park, CA 91754
Estimated Value: $687,036 - $910,000
2
Beds
1
Bath
874
Sq Ft
$900/Sq Ft
Est. Value
About This Home
This home is located at 509 S Ynez Ave, Monterey Park, CA 91754 and is currently estimated at $786,259, approximately $899 per square foot. 509 S Ynez Ave is a home located in Los Angeles County with nearby schools including Brightwood Elementary School, Mark Keppel High School, and St. Stephen Martyr School.
Ownership History
Date
Name
Owned For
Owner Type
Purchase Details
Closed on
Aug 8, 2018
Sold by
Park Monterey
Bought by
Pingol Fecicidad C and Felicidao C Pingol Revocable Living Trus
Current Estimated Value
Purchase Details
Closed on
Mar 8, 2001
Sold by
Pingol Felicidad C
Bought by
Pingol Felicidad C
Home Financials for this Owner
Home Financials are based on the most recent Mortgage that was taken out on this home.
Original Mortgage
$136,700
Interest Rate
7.11%
Create a Home Valuation Report for This Property
The Home Valuation Report is an in-depth analysis detailing your home's value as well as a comparison with similar homes in the area
Home Values in the Area
Average Home Value in this Area
Purchase History
| Date | Buyer | Sale Price | Title Company |
|---|---|---|---|
| Pingol Fecicidad C | -- | None Available | |
| Pingol Felicidad C | -- | Orange Coast Title |
Source: Public Records
Mortgage History
| Date | Status | Borrower | Loan Amount |
|---|---|---|---|
| Closed | Pingol Felicidad C | $136,700 |
Source: Public Records
Tax History Compared to Growth
Tax History
| Year | Tax Paid | Tax Assessment Tax Assessment Total Assessment is a certain percentage of the fair market value that is determined by local assessors to be the total taxable value of land and additions on the property. | Land | Improvement |
|---|---|---|---|---|
| 2025 | $4,375 | $328,364 | $287,289 | $41,075 |
| 2024 | $4,375 | $321,926 | $281,656 | $40,270 |
| 2023 | $4,285 | $315,615 | $276,134 | $39,481 |
| 2022 | $4,085 | $309,427 | $270,720 | $38,707 |
| 2021 | $4,033 | $303,361 | $265,412 | $37,949 |
| 2019 | $3,891 | $294,365 | $257,541 | $36,824 |
| 2018 | $3,859 | $288,594 | $252,492 | $36,102 |
| 2016 | $3,579 | $277,390 | $242,689 | $34,701 |
| 2015 | $3,521 | $273,224 | $239,044 | $34,180 |
| 2014 | $3,475 | $267,873 | $234,362 | $33,511 |
Source: Public Records
Map
Nearby Homes
- 419 S Chandler Ave Unit 521
- 408 De la Fuente St
- 701 S Garfield Ave
- 125 S Moore Ave Unit 2
- 311 Montechico Dr
- 421 S Garfield Ave Unit 79
- 411 S Garfield Ave
- 438 S Garfield Ave Unit E
- 863 S Lincoln Ave
- 1141 Williams St
- 824 De la Fuente St
- 1100 S Grandridge Ave
- 418 S Lincoln Ave
- 0 Garvey Ave Unit MB21123625
- 259 Fremont Ave
- 215 W Garcelon Ave
- 513 W Emerson Ave Unit C
- 402 N Ynez Ave
- 305 N Baltimore Ave Unit C
- 419 N Chandler Ave Unit 508
- 511 S Ynez Ave
- 503 S Ynez Ave
- 608 Harding Ave
- 515 S Ynez Ave Unit B
- 515 S Ynez Ave
- 612 Harding Ave
- 519 S Ynez Ave
- 616 Harding Ave
- 508 S Ynez Ave
- 510 S Ynez Ave
- 521 S Ynez Ave
- 506 S Ynez Ave
- 514 S Ynez Ave
- 518 S Ynez Ave
- 618 Harding Ave
- 444 S Moore Ave
- 502 S Ynez Ave
- 435 S Moore Ave
- 609 W Graves Ave
- 525 S Ynez Ave