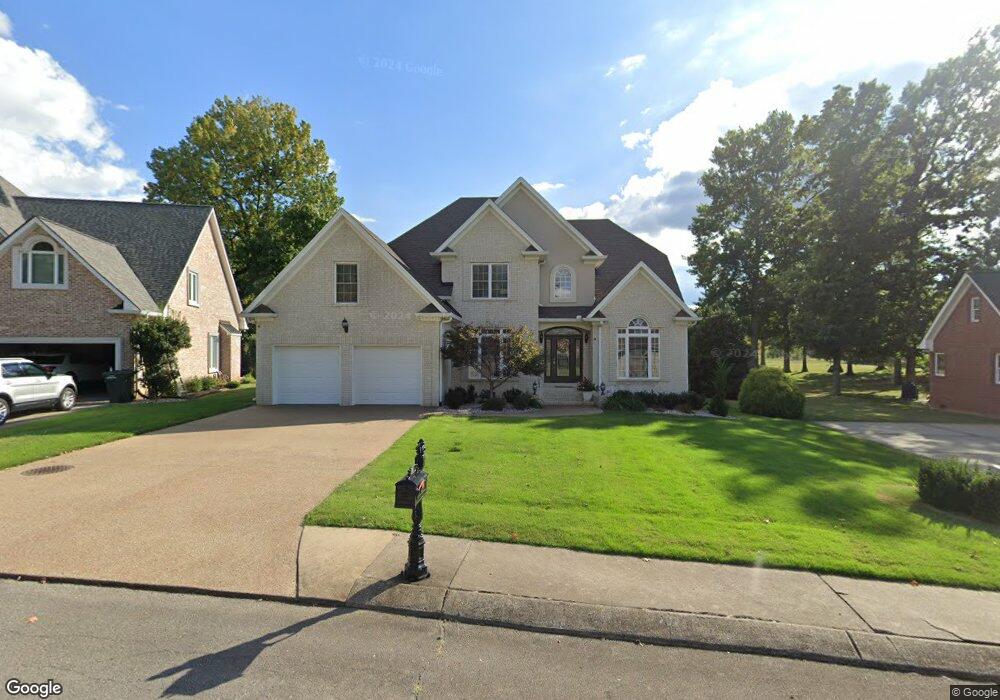
509 Scramblers Point Springfield, TN 37172
Estimated Value: $569,362 - $675,000
4
Beds
3
Baths
3,419
Sq Ft
$182/Sq Ft
Est. Value
About This Home
This home is located at 509 Scramblers Point, Springfield, TN 37172 and is currently estimated at $621,591, approximately $181 per square foot. 509 Scramblers Point is a home located in Robertson County with nearby schools including Crestview Elementary School, Innovation Academy, and Springfield High School.
Ownership History
Date
Name
Owned For
Owner Type
Purchase Details
Closed on
Jul 30, 2018
Sold by
Alley Gary H and Alley Patricia A
Bought by
Smith Terry Lynn
Current Estimated Value
Purchase Details
Closed on
May 24, 2010
Sold by
Broadbent Jerry Wayne
Bought by
Alley Gary W
Home Financials for this Owner
Home Financials are based on the most recent Mortgage that was taken out on this home.
Original Mortgage
$36,000
Interest Rate
5.03%
Purchase Details
Closed on
Jan 31, 2005
Sold by
John Dale
Bought by
Wayne Broadbent Jerry
Purchase Details
Closed on
Mar 10, 2004
Sold by
Dorris Denise D and Dorris Philip A
Bought by
John Dale
Purchase Details
Closed on
Sep 17, 2002
Bought by
Dale John
Purchase Details
Closed on
Apr 8, 1993
Bought by
Dorris Philip A and Dorris Denise D
Create a Home Valuation Report for This Property
The Home Valuation Report is an in-depth analysis detailing your home's value as well as a comparison with similar homes in the area
Home Values in the Area
Average Home Value in this Area
Purchase History
| Date | Buyer | Sale Price | Title Company |
|---|---|---|---|
| Smith Terry Lynn | $358,735 | None Available | |
| Alley Gary W | $36,000 | -- | |
| Wayne Broadbent Jerry | $28,000 | -- | |
| John Dale | $32,000 | -- | |
| Dale John | $32,000 | -- | |
| Dorris Philip A | -- | -- |
Source: Public Records
Mortgage History
| Date | Status | Borrower | Loan Amount |
|---|---|---|---|
| Previous Owner | Dorris Philip A | $36,000 |
Source: Public Records
Tax History
| Year | Tax Paid | Tax Assessment Tax Assessment Total Assessment is a certain percentage of the fair market value that is determined by local assessors to be the total taxable value of land and additions on the property. | Land | Improvement |
|---|---|---|---|---|
| 2025 | -- | $142,775 | $25,000 | $117,775 |
| 2024 | -- | $142,775 | $25,000 | $117,775 |
| 2023 | $3,577 | $142,775 | $25,000 | $117,775 |
| 2022 | $3,457 | $94,750 | $10,000 | $84,750 |
| 2021 | $3,457 | $94,750 | $10,000 | $84,750 |
| 2020 | $3,457 | $94,750 | $10,000 | $84,750 |
| 2019 | $104,041 | $94,750 | $10,000 | $84,750 |
| 2018 | $3,457 | $94,750 | $10,000 | $84,750 |
| 2017 | $3,579 | $83,525 | $10,000 | $73,525 |
| 2016 | $3,579 | $83,525 | $10,000 | $73,525 |
| 2015 | $3,475 | $83,525 | $10,000 | $73,525 |
| 2014 | $3,475 | $83,525 | $10,000 | $73,525 |
Source: Public Records
Map
Nearby Homes
- 3608 Legacy Dr
- 200 Champions Dr
- 558 W Foxrun
- 557 W Foxrun
- 563 W Foxrun
- 476 W Foxrun
- 470 W Foxrun Unit Lot 39
- 470 W Foxrun
- 464 W Foxrun
- 464 W Foxrun Unit Lot 40
- 3504 Oakland Rd
- 3502 Oakland Rd
- 3506 Oakland Rd
- 141 Foxrun
- 3679 Old Greenbrier Pike
- 128 Fieldstone Ln
- 349 Fieldstone Ln
- 340 Fieldstone Ln
- 312 Brandywine Ln
- 238 Clydesdale Ln
- 513 Scramblers Point
- 501 Scramblers Point
- 502 Scramblers Point
- 405 Founders Ct
- 525 Scramblers Point
- 410 Founders Ct
- 413 Founders Ct
- 308 Champion Dr
- 306 Champion Dr
- 304 Champion Dr
- 3382 Legacy Dr
- 302 Champion Dr
- 300 Champion Dr
- 208 Champion Dr
- 3573 Legacy Dr
- 206 Champion Dr
- 204 Champion Dr
- 202 Champion Dr
- 200 Champion Dr
- 3368 Legacy Dr
Your Personal Tour Guide
Ask me questions while you tour the home.