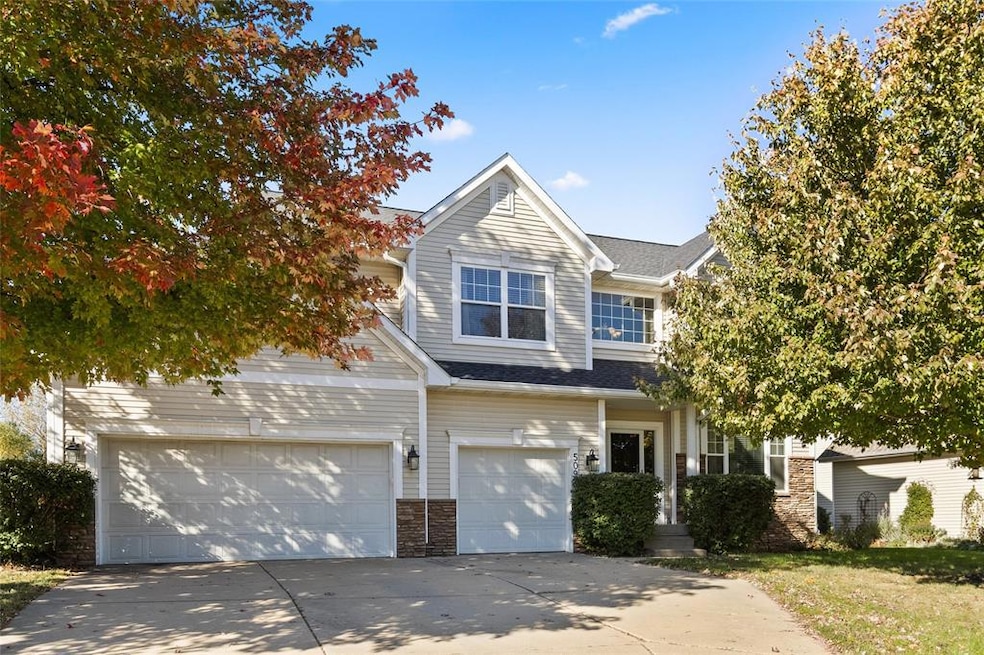
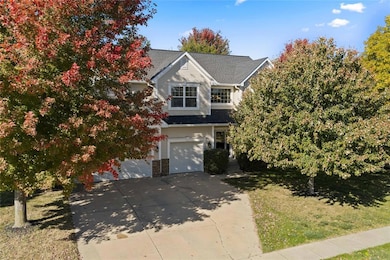
509 SW Hickory Glen Grimes, IA 50111
Estimated payment $3,307/month
Highlights
- Deck
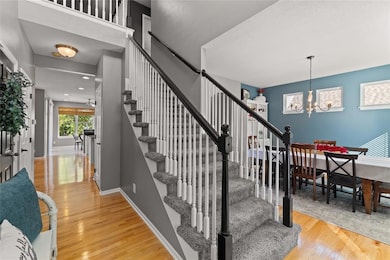
- Wood Flooring
- No HOA
- Dallas Center-Grimes Middle School Rated 9+
- Sun or Florida Room
- 2-minute walk to Kennybrook South Park
About This Home
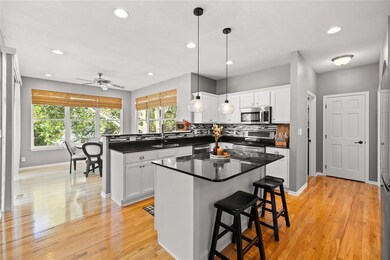
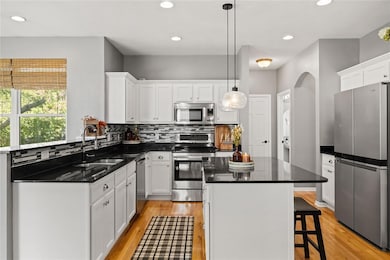
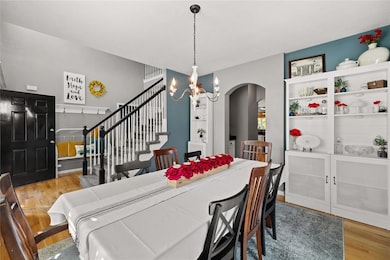
Beautifully Updated Home with a Huge Backyard in Grimes! Very large walk-out basement home that's move-in-ready, packed with updates and charm. Step inside to find sprawling hardwood floors that flow throughout the main level, creating a warm and inviting feel. The home has seen many updates, blending modern touches with timeless style that offers 4 bedrooms and 3 bathroom (basement stubbed for full bathroom). Enjoy a bright, open layout perfect for everyday living and entertaining. Outside, the massive backyard offers endless space to play, relax, or host gatherings. Conveniently located near parks, schools, and easy highway access, this one checks all the boxes for comfort and convenience in the heart of Grimes!
Home Details
Home Type
- Single Family
Est. Annual Taxes
- $8,646
Year Built
- Built in 2005
Lot Details
- 0.35 Acre Lot
- Property is zoned R2-70
Home Design
- Asphalt Shingled Roof
- Vinyl Siding
Interior Spaces
- 2,444 Sq Ft Home
- 2-Story Property
- Gas Fireplace
- Family Room
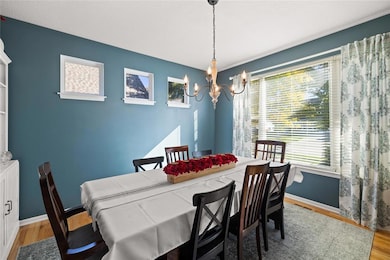
- Formal Dining Room
- Sun or Florida Room
- Walk-Out Basement
- Laundry on main level
Kitchen
- Eat-In Kitchen
- Stove
- Microwave
- Dishwasher
Flooring
- Wood
- Carpet
Bedrooms and Bathrooms
- 4 Bedrooms
Parking
- 3 Car Attached Garage
- Driveway
Outdoor Features
- Deck
Utilities
- Forced Air Heating and Cooling System
- Cable TV Available
Community Details
- No Home Owners Association
Listing and Financial Details
- Assessor Parcel Number 31100305927709
Map
Home Values in the Area
Average Home Value in this Area
Tax History
| Year | Tax Paid | Tax Assessment Tax Assessment Total Assessment is a certain percentage of the fair market value that is determined by local assessors to be the total taxable value of land and additions on the property. | Land | Improvement |
|---|---|---|---|---|
| 2025 | $8,454 | $498,600 | $73,900 | $424,700 |
| 2024 | $8,454 | $462,700 | $67,000 | $395,700 |
| 2023 | $8,154 | $462,700 | $67,000 | $395,700 |
| 2022 | $8,206 | $380,300 | $57,100 | $323,200 |
| 2021 | $7,824 | $380,300 | $57,100 | $323,200 |
| 2020 | $7,700 | $351,200 | $52,800 | $298,400 |
| 2019 | $7,716 | $351,200 | $52,800 | $298,400 |
| 2018 | $7,970 | $330,300 | $44,800 | $285,500 |
| 2017 | $7,230 | $330,300 | $44,800 | $285,500 |
| 2016 | $6,926 | $293,300 | $36,200 | $257,100 |
| 2015 | $6,926 | $293,300 | $36,200 | $257,100 |
| 2014 | $6,814 | $293,200 | $35,600 | $257,600 |
Property History
| Date | Event | Price | List to Sale | Price per Sq Ft |
|---|---|---|---|---|
| 11/11/2025 11/11/25 | Pending | -- | -- | -- |
| 11/05/2025 11/05/25 | Price Changed | $489,900 | -2.0% | $200 / Sq Ft |
| 10/24/2025 10/24/25 | For Sale | $499,900 | -- | $205 / Sq Ft |
Purchase History
| Date | Type | Sale Price | Title Company |
|---|---|---|---|
| Warranty Deed | $313,000 | None Available | |
| Interfamily Deed Transfer | -- | None Available | |
| Warranty Deed | $314,500 | Itc | |
| Warranty Deed | -- | None Available |
Mortgage History
| Date | Status | Loan Amount | Loan Type |
|---|---|---|---|
| Open | $292,900 | New Conventional | |
| Previous Owner | $314,956 | Fannie Mae Freddie Mac |
Source: Des Moines Area Association of REALTORS®
MLS Number: 729085
APN: 311-00305927709
Disclaimer: Certain information contained herein is derived from information provided by parties other than Homes.com. All information provided is deemed reliable, but is not guaranteed to be accurate and should be independently verified.
![]() IDX information is provided exclusively for personal, non-commercial use, and may not be used for any purpose other than to identify prospective properties consumers may be interested in purchasing. Information is deemed reliable but not guaranteed.
IDX information is provided exclusively for personal, non-commercial use, and may not be used for any purpose other than to identify prospective properties consumers may be interested in purchasing. Information is deemed reliable but not guaranteed.
- 411 SW Kennybrook Dr
- 1408 SW 7th St
- 300 NW Sunset Ln
- 44 West Plan at 44 West
- 113 NW Maplewood Dr
- 1214 NW 3rd St
- 905 NW 3rd Ct
- 434 NW Prairie Creek Dr
- 309 NW Beechwood Dr
- 219 NW Calista Ct
- 813 SW Cattail Rd
- 401 NW Valley View Dr
- 781 SW Cattail Rd
- 613 NW Harvest Ct
- 677 SW Cattail Rd
- 753 SW Cattail Rd
- 715 SW Cattail Rd
- 1091 SW Cattail Rd
- 847 SW Cattail Rd
- 873 SW Cattail Rd
