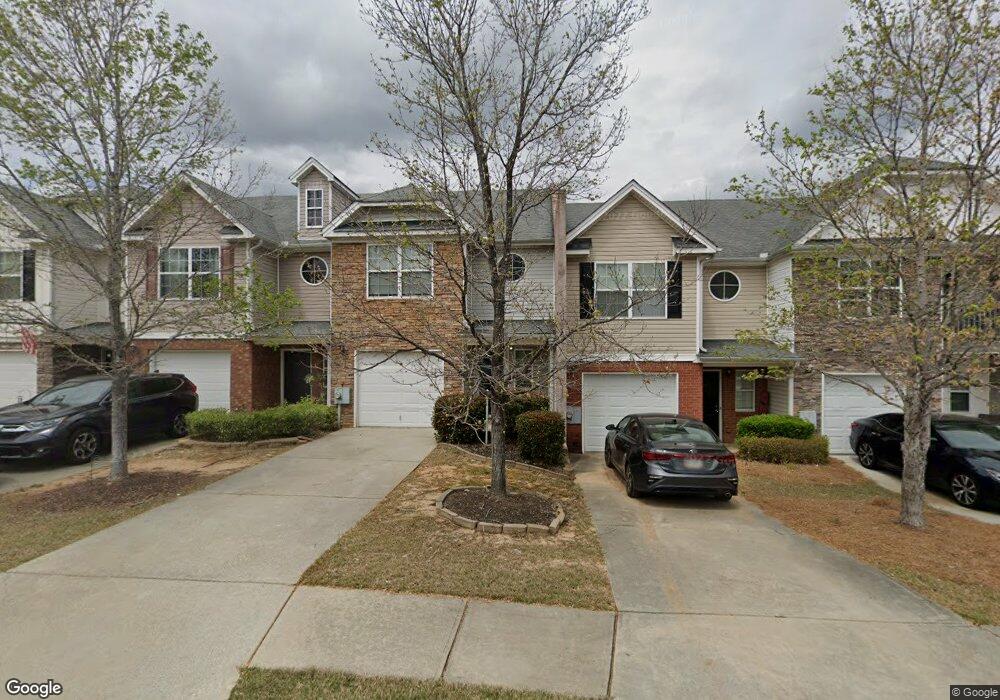
509 Terrapin Ln Unit 1 Winder, GA 30680
Estimated Value: $248,000 - $270,638
3
Beds
3
Baths
1,268
Sq Ft
$206/Sq Ft
Est. Value
About This Home
This home is located at 509 Terrapin Ln Unit 1, Winder, GA 30680 and is currently estimated at $261,660, approximately $206 per square foot. 509 Terrapin Ln Unit 1 is a home located in Barrow County with nearby schools including Kennedy Elementary School, Westside Middle School, and Apalachee High School.
Ownership History
Date
Name
Owned For
Owner Type
Purchase Details
Closed on
Jan 31, 2022
Sold by
Murray Cori L
Bought by
Spence Joseph C
Current Estimated Value
Home Financials for this Owner
Home Financials are based on the most recent Mortgage that was taken out on this home.
Original Mortgage
$203,143
Outstanding Balance
$188,657
Interest Rate
3.56%
Mortgage Type
FHA
Estimated Equity
$73,004
Purchase Details
Closed on
Oct 5, 2007
Sold by
Star Hm Bldrs Inc
Bought by
Murray Cori L
Home Financials for this Owner
Home Financials are based on the most recent Mortgage that was taken out on this home.
Original Mortgage
$118,567
Interest Rate
6.49%
Mortgage Type
FHA
Purchase Details
Closed on
Jul 22, 2005
Sold by
Brookstone Developers Llc
Bought by
Star Home Builders Inc
Purchase Details
Closed on
Feb 11, 2004
Bought by
Brookstone Developers Llc
Create a Home Valuation Report for This Property
The Home Valuation Report is an in-depth analysis detailing your home's value as well as a comparison with similar homes in the area
Home Values in the Area
Average Home Value in this Area
Purchase History
| Date | Buyer | Sale Price | Title Company |
|---|---|---|---|
| Spence Joseph C | $207,000 | -- | |
| Murray Cori L | $119,600 | -- | |
| Star Home Builders Inc | $26,600 | -- | |
| Brookstone Developers Llc | -- | -- |
Source: Public Records
Mortgage History
| Date | Status | Borrower | Loan Amount |
|---|---|---|---|
| Open | Spence Joseph C | $203,143 | |
| Previous Owner | Murray Cori L | $118,567 |
Source: Public Records
Tax History Compared to Growth
Tax History
| Year | Tax Paid | Tax Assessment Tax Assessment Total Assessment is a certain percentage of the fair market value that is determined by local assessors to be the total taxable value of land and additions on the property. | Land | Improvement |
|---|---|---|---|---|
| 2024 | $2,505 | $86,567 | $19,200 | $67,367 |
| 2023 | $2,343 | $86,567 | $19,200 | $67,367 |
| 2022 | $2,536 | $74,594 | $17,600 | $56,994 |
| 2021 | $2,178 | $59,771 | $12,800 | $46,971 |
| 2020 | $1,796 | $51,090 | $10,800 | $40,290 |
| 2019 | $1,768 | $49,490 | $9,200 | $40,290 |
| 2018 | $1,550 | $43,020 | $9,200 | $33,820 |
| 2017 | $1,009 | $33,821 | $8,000 | $25,821 |
| 2016 | $955 | $27,396 | $6,000 | $21,396 |
| 2015 | $964 | $27,629 | $6,000 | $21,629 |
| 2014 | $850 | $24,032 | $2,170 | $21,862 |
| 2013 | -- | $24,497 | $2,170 | $22,327 |
Source: Public Records
Map
Nearby Homes
- 526 Terrapin Ln
- 1468 Box Cir
- 164 Turtle Creek Dr
- 347 Turtle Creek Dr
- 1734 Snapping Ct
- 348 Turtle Creek Dr
- 346 Turtle Creek Dr
- 222 Turtle Creek Dr
- 132 Poplar Way
- 1993 Township Dr
- 94 Matthews School Rd
- 145 Humphry Ct
- 155 Horton St
- 2036 Massey Ln
- 621 Loganville Hwy
- 281 Hillside Dr
- 132 Circle Dr
- 0 Horton St Unit 10650235
- 0 Horton St Unit 10643908
- 0 Horton St Unit 7688404
- 511 Terrapin Ln
- 507 Terrapin Ln Unit 22B
- 513 Terrapin Ln Unit 25
- 513 Terrapin Ln
- 513 Terrapin Ln Unit 1
- 505 Terrapin Ln
- 503 Terrapin Ln
- 503 Terrapin Ln Unit 20B
- 503 Terrapin Ln Unit 1/Lot 20
- 515 Terrapin Ln
- 156 Turtle Creek Drive14b
- 501 Terrapin Ln
- 154 Turtle Creek Dr
- 156 Turtle Creek Dr
- 152 Turtle Creek Dr
- 150 Turtle Creek Dr Unit 17B
- 150 Turtle Creek Dr
- 148 Turtle Creek Dr Unit 1
- 162 Turtle Creek Dr
- 508 Terrapin Ln Unit 1