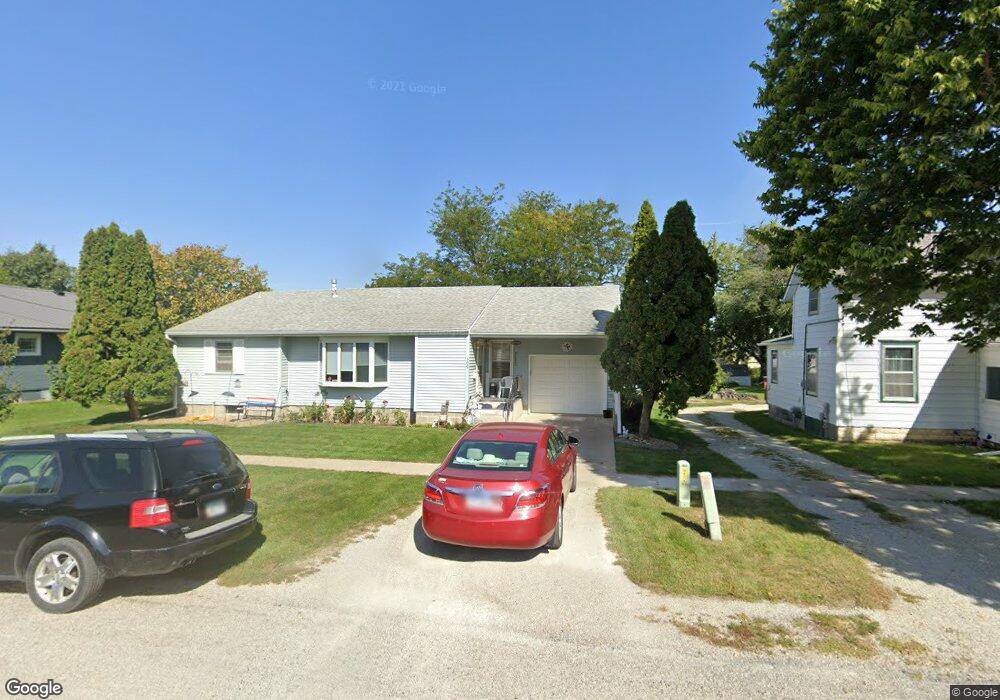
509 W 12th St Vinton, IA 52349
Estimated Value: $176,231 - $185,000
2
Beds
4
Baths
1,281
Sq Ft
$141/Sq Ft
Est. Value
About This Home
This home is located at 509 W 12th St, Vinton, IA 52349 and is currently estimated at $181,077, approximately $141 per square foot. 509 W 12th St is a home located in Benton County with nearby schools including Tilford Elementary School, Shellsburg Elementary School, and Vinton-Shellsburg Middle School.
Ownership History
Date
Name
Owned For
Owner Type
Purchase Details
Closed on
Jul 18, 2024
Sold by
Thomas R Robinson R and Thomas Vivian C
Bought by
Brian R Miller Revocable Trust and Miller
Current Estimated Value
Purchase Details
Closed on
Jun 9, 2010
Sold by
Hurst Melivin A and Hurst Anna M
Bought by
Hurst Je Melvin A and Hurst Anna M
Home Financials for this Owner
Home Financials are based on the most recent Mortgage that was taken out on this home.
Original Mortgage
$92,000
Interest Rate
5.16%
Mortgage Type
New Conventional
Purchase Details
Closed on
May 13, 2010
Sold by
Duncan Marlyn W and Duncan Kathryn M
Bought by
Hurst Melvin A and Hurst Anna M
Home Financials for this Owner
Home Financials are based on the most recent Mortgage that was taken out on this home.
Original Mortgage
$92,000
Interest Rate
5.16%
Mortgage Type
New Conventional
Create a Home Valuation Report for This Property
The Home Valuation Report is an in-depth analysis detailing your home's value as well as a comparison with similar homes in the area
Home Values in the Area
Average Home Value in this Area
Purchase History
| Date | Buyer | Sale Price | Title Company |
|---|---|---|---|
| Brian R Miller Revocable Trust | $685,000 | None Listed On Document | |
| Hurst Je Melvin A | $11,125 | -- | |
| Hurst Melvin A | $115,000 | None Available |
Source: Public Records
Mortgage History
| Date | Status | Borrower | Loan Amount |
|---|---|---|---|
| Previous Owner | Hurst Melvin A | $92,000 |
Source: Public Records
Tax History Compared to Growth
Tax History
| Year | Tax Paid | Tax Assessment Tax Assessment Total Assessment is a certain percentage of the fair market value that is determined by local assessors to be the total taxable value of land and additions on the property. | Land | Improvement |
|---|---|---|---|---|
| 2025 | $2,502 | $174,400 | $17,400 | $157,000 |
| 2024 | $2,502 | $157,500 | $16,700 | $140,800 |
| 2023 | $2,542 | $157,500 | $16,700 | $140,800 |
| 2022 | $2,608 | $127,000 | $13,300 | $113,700 |
| 2021 | $2,608 | $127,000 | $13,300 | $113,700 |
| 2020 | $2,514 | $125,000 | $12,000 | $113,000 |
| 2019 | $2,512 | $125,000 | $12,000 | $113,000 |
| 2018 | $2,436 | $123,100 | $11,300 | $111,800 |
| 2017 | $2,338 | $123,100 | $11,300 | $111,800 |
| 2016 | $2,296 | $115,100 | $10,600 | $104,500 |
| 2015 | $2,296 | $115,100 | $10,600 | $104,500 |
| 2014 | $2,426 | $120,900 | $0 | $0 |
Source: Public Records
Map
Nearby Homes