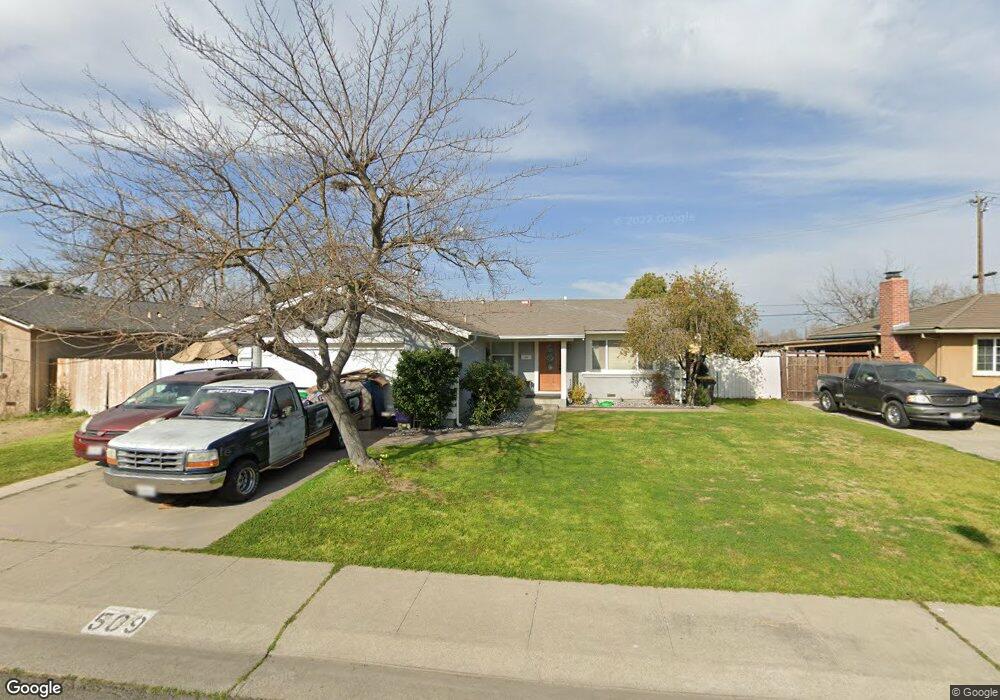
509 W Pardee Ln Stockton, CA 95207
Lincoln Village NeighborhoodEstimated Value: $321,000 - $385,000
3
Beds
2
Baths
1,183
Sq Ft
$300/Sq Ft
Est. Value
About This Home
This home is located at 509 W Pardee Ln, Stockton, CA 95207 and is currently estimated at $354,665, approximately $299 per square foot. 509 W Pardee Ln is a home located in San Joaquin County with nearby schools including Maxine Hong Kingston Elementary School, Adams Elementary School, and Pulliam Elementary School.
Ownership History
Date
Name
Owned For
Owner Type
Purchase Details
Closed on
Mar 29, 2018
Sold by
Sound Image Llc
Bought by
Saleh Mahmoud and Ali Rajaa Mohrez
Current Estimated Value
Purchase Details
Closed on
Aug 24, 2017
Sold by
Saleh Mahmoud and Saleh Rajaa
Bought by
Saleh Mahmoud and Saleh Rajaa
Purchase Details
Closed on
Apr 27, 2017
Sold by
Saleh Mahmoud and Ali Rajaa Mohrez
Bought by
Sound Image Llc
Purchase Details
Closed on
Dec 20, 2012
Sold by
Garcia Andrew
Bought by
Sale Mahmoud Saleh Raja
Purchase Details
Closed on
Nov 6, 2006
Sold by
Griffen Frank D and Frederick Charles Hagene Livin
Bought by
Garcia Andrew
Home Financials for this Owner
Home Financials are based on the most recent Mortgage that was taken out on this home.
Original Mortgage
$216,000
Interest Rate
8.12%
Mortgage Type
Purchase Money Mortgage
Purchase Details
Closed on
Mar 15, 2000
Sold by
Hagene Fred C
Bought by
Hagene Frederick Charles and Frederick Charles Hagene Livin
Create a Home Valuation Report for This Property
The Home Valuation Report is an in-depth analysis detailing your home's value as well as a comparison with similar homes in the area
Home Values in the Area
Average Home Value in this Area
Purchase History
| Date | Buyer | Sale Price | Title Company |
|---|---|---|---|
| Saleh Mahmoud | -- | None Available | |
| Saleh Mahmoud | -- | None Available | |
| Sound Image Llc | -- | None Available | |
| Sale Mahmoud Saleh Raja | $95,000 | None Available | |
| Garcia Andrew | $270,000 | Old Republic Title Company | |
| Hagene Frederick Charles | -- | -- |
Source: Public Records
Mortgage History
| Date | Status | Borrower | Loan Amount |
|---|---|---|---|
| Previous Owner | Garcia Andrew | $216,000 |
Source: Public Records
Tax History
| Year | Tax Paid | Tax Assessment Tax Assessment Total Assessment is a certain percentage of the fair market value that is determined by local assessors to be the total taxable value of land and additions on the property. | Land | Improvement |
|---|---|---|---|---|
| 2025 | $1,498 | $116,977 | $36,939 | $80,038 |
| 2024 | $1,474 | $114,684 | $36,215 | $78,469 |
| 2023 | $1,441 | $112,436 | $35,505 | $76,931 |
| 2022 | $1,394 | $110,232 | $34,809 | $75,423 |
| 2021 | $1,339 | $108,072 | $34,127 | $73,945 |
| 2020 | $1,365 | $106,965 | $33,778 | $73,187 |
| 2019 | $1,359 | $104,868 | $33,116 | $71,752 |
| 2018 | $1,334 | $102,813 | $32,467 | $70,346 |
| 2017 | $1,265 | $100,798 | $31,831 | $68,967 |
| 2016 | $1,287 | $98,822 | $31,207 | $67,615 |
| 2014 | $1,226 | $95,431 | $30,136 | $65,295 |
Source: Public Records
Map
Nearby Homes
- 701 W Bianchi Rd
- 4332 Pacific Ave Unit 80
- 4332 Pacific Ave Unit 25
- 4332 Pacific Ave
- 328 Northbank Ct Unit 79
- 4229 N Commerce St
- 40 E Harper St
- 6 W Fargo St
- 4119 N Commerce St
- 1109 W Churchill St
- 190 W Mckenzie Ave
- 1217 W Churchill St
- 5501 Claremont Ave
- 5310 N El Dorado St Unit 7
- 4452 Cotton Ct
- 39 W Fulton St
- 2329 Lido Cir
- 4425 La Cresta Way Unit 4
- 414 E Bianchi Rd Unit 2
- 5714 Claremont Ave
- 515 W Pardee Ln
- 503 W Pardee Ln
- 435 W Pardee Ln
- 4614 Pacific Ave
- 512 W Pardee Ln
- 506 W Pardee Ln
- 518 W Pardee Ln
- 430 W Pardee Ln
- 429 W Pardee Ln
- 524 W Pardee Ln
- 4533 Rialto Place
- 424 W Pardee Ln
- 423 W Pardee Ln
- 4530 Rialto Place
- 4527 Rialto Place
- 4532 Pacific Ave
- 4611 Nugget Ave
- 417 W Pardee Ln
- 4603 Nugget Ave
- 4526 Pacific Ave
Your Personal Tour Guide
Ask me questions while you tour the home.