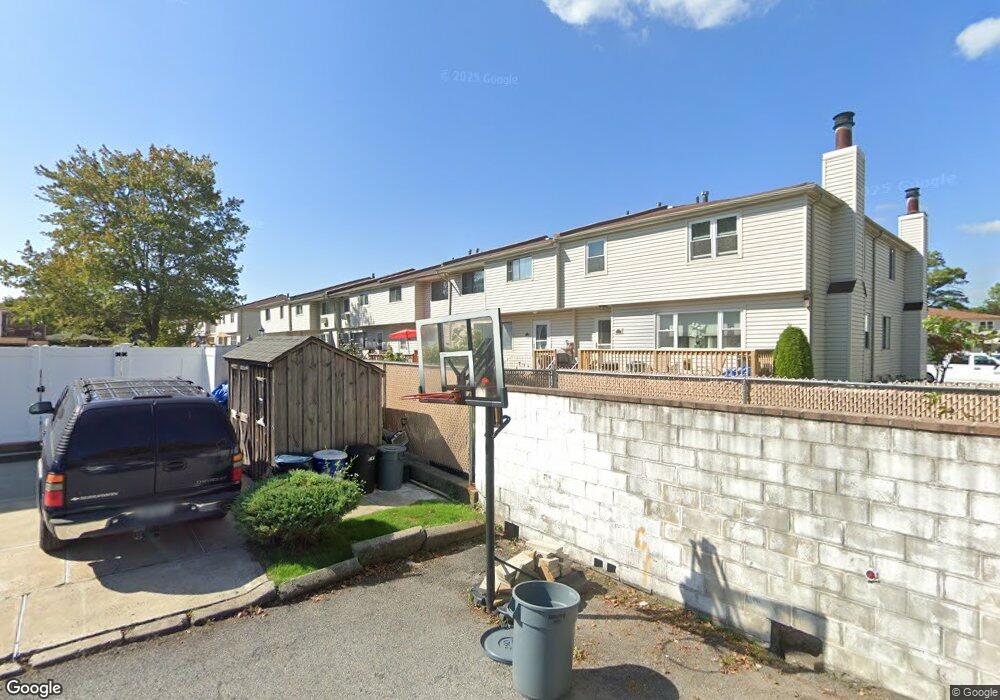
509 Willow Rd E Staten Island, NY 10314
Westerleigh NeighborhoodEstimated Value: $485,000 - $539,000
2
Beds
2
Baths
1,300
Sq Ft
$387/Sq Ft
Est. Value
About This Home
This home is located at 509 Willow Rd E, Staten Island, NY 10314 and is currently estimated at $503,199, approximately $387 per square foot. 509 Willow Rd E is a home located in Richmond County with nearby schools including P.S. 30 Westerleigh, I.S. 51 Edwin Markham, and Port Richmond High School.
Ownership History
Date
Name
Owned For
Owner Type
Purchase Details
Closed on
Dec 3, 2009
Sold by
Galarza Vincent
Bought by
Ceso Ahmet and Ceso Sabaheta
Current Estimated Value
Home Financials for this Owner
Home Financials are based on the most recent Mortgage that was taken out on this home.
Original Mortgage
$216,015
Outstanding Balance
$141,619
Interest Rate
5%
Mortgage Type
FHA
Estimated Equity
$361,580
Purchase Details
Closed on
Jun 30, 2005
Sold by
Dantuono Iris
Bought by
Galarza Vincent
Home Financials for this Owner
Home Financials are based on the most recent Mortgage that was taken out on this home.
Original Mortgage
$265,900
Interest Rate
5.67%
Mortgage Type
FHA
Purchase Details
Closed on
Jun 11, 1997
Sold by
Hunton Douglas Alfred and Hunton Diana L
Bought by
Dantuono Iris
Home Financials for this Owner
Home Financials are based on the most recent Mortgage that was taken out on this home.
Original Mortgage
$89,300
Interest Rate
7.81%
Create a Home Valuation Report for This Property
The Home Valuation Report is an in-depth analysis detailing your home's value as well as a comparison with similar homes in the area
Home Values in the Area
Average Home Value in this Area
Purchase History
| Date | Buyer | Sale Price | Title Company |
|---|---|---|---|
| Ceso Ahmet | $220,000 | Ticor Title Insurance Co | |
| Galarza Vincent | $274,500 | Commonwealth Title | |
| Dantuono Iris | $94,000 | -- |
Source: Public Records
Mortgage History
| Date | Status | Borrower | Loan Amount |
|---|---|---|---|
| Open | Ceso Ahmet | $216,015 | |
| Previous Owner | Galarza Vincent | $265,900 | |
| Previous Owner | Dantuono Iris | $89,300 |
Source: Public Records
Tax History
| Year | Tax Paid | Tax Assessment Tax Assessment Total Assessment is a certain percentage of the fair market value that is determined by local assessors to be the total taxable value of land and additions on the property. | Land | Improvement |
|---|---|---|---|---|
| 2025 | $3,734 | $32,994 | $903 | $32,091 |
| 2024 | $3,734 | $26,967 | $1,097 | $25,870 |
| 2023 | $3,563 | $17,542 | $1,111 | $16,431 |
| 2022 | $3,304 | $22,367 | $1,591 | $20,776 |
| 2021 | $3,286 | $20,236 | $1,591 | $18,645 |
| 2020 | $3,305 | $20,767 | $1,591 | $19,176 |
| 2019 | $3,241 | $19,408 | $1,591 | $17,817 |
| 2018 | $2,980 | $14,618 | $1,234 | $13,384 |
| 2017 | $2,811 | $13,791 | $1,263 | $12,528 |
| 2016 | $2,601 | $13,011 | $1,246 | $11,765 |
| 2015 | $2,478 | $13,011 | $1,307 | $11,704 |
| 2014 | $2,478 | $12,912 | $1,211 | $11,701 |
Source: Public Records
Map
Nearby Homes
- 226 Cambridge Ave
- 234 Cambridge Ave
- 238 Cambridge Ave
- 537 Willow Rd E Unit 1
- 251 Cambridge Ave
- 205 Hawthorne Ave
- 11 Denton Place
- 11 Thurston St
- 448-2 Caswell Ave
- 493 Willowbrook Rd
- 22 Francine Ln
- 777-805 Willowbrook Rd
- 465 Stewart Ave
- 471 Stewart Ave
- 467 Stewart Ave
- 74 Sumner Ave
- 37 Dreyer Ave Unit A
- 2441 Victory Blvd
- 2439 Victory Blvd
- 2437 Victory Blvd
- 525 Willow Rd E Unit 2
- 525 Willow Rd E Unit 1
- 509 Willow Rd E Unit 2
- 503 Willow Rd E Unit 2
- 503 Willow Rd E Unit 1
- 509 Willow Rd E Unit 1
- 503 Willow Rd E
- 513 Willow Rd E Unit 2
- 513 Willow Rd E Unit 1
- 513 Willow Rd E
- 511 Willow Rd E Unit 2
- 511 Willow Rd E Unit 1
- 511 Willow Rd E
- 507 Willow Rd E Unit 2
- 507 Willow Rd E Unit 1
- 507 Willow Rd E
- 523 Willow Rd E Unit 2
- 523 Willow Rd E Unit 1
- 529 Willow Rd E Unit 2
- 527 Willow Rd E Unit 2
Your Personal Tour Guide
Ask me questions while you tour the home.