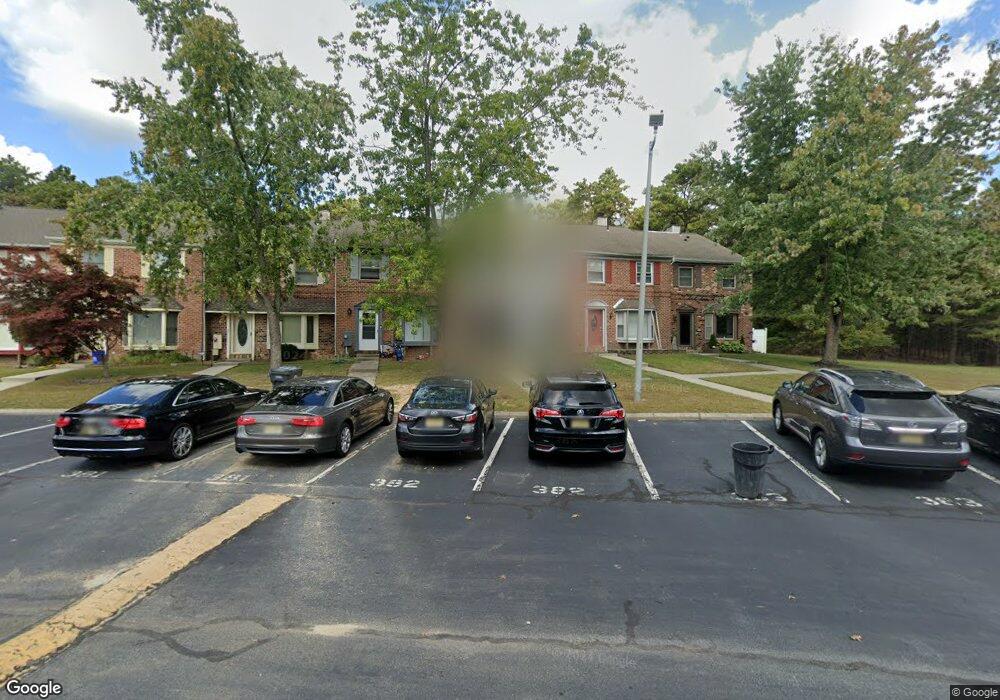
5096 Radnor Ct Mays Landing, NJ 08330
Estimated Value: $241,000 - $253,000
--
Bed
--
Bath
1,712
Sq Ft
$145/Sq Ft
Est. Value
About This Home
This home is located at 5096 Radnor Ct, Mays Landing, NJ 08330 and is currently estimated at $248,959, approximately $145 per square foot. 5096 Radnor Ct is a home located in Atlantic County with nearby schools including George L. Hess Educational Complex, Joseph Shaner School, and William Davies Middle School.
Ownership History
Date
Name
Owned For
Owner Type
Purchase Details
Closed on
May 21, 2002
Sold by
Hud
Bought by
Haddad Reem and Haddad Khalil
Current Estimated Value
Purchase Details
Closed on
Dec 28, 1999
Sold by
Federal National Mortgage Association
Bought by
Dixon Marion L
Home Financials for this Owner
Home Financials are based on the most recent Mortgage that was taken out on this home.
Original Mortgage
$71,250
Interest Rate
7.79%
Mortgage Type
Purchase Money Mortgage
Purchase Details
Closed on
Sep 7, 1999
Sold by
Schifris Charles and Schifris Judith
Bought by
Federal National Mortgage Association
Purchase Details
Closed on
Sep 18, 1989
Sold by
Fabro Development Co Inc
Bought by
Scifris Charles and Scifris Judith
Create a Home Valuation Report for This Property
The Home Valuation Report is an in-depth analysis detailing your home's value as well as a comparison with similar homes in the area
Home Values in the Area
Average Home Value in this Area
Purchase History
| Date | Buyer | Sale Price | Title Company |
|---|---|---|---|
| Haddad Reem | $78,000 | Independence Abstract & Titl | |
| Dixon Marion L | $75,000 | -- | |
| Federal National Mortgage Association | -- | -- | |
| Scifris Charles | $103,500 | -- |
Source: Public Records
Mortgage History
| Date | Status | Borrower | Loan Amount |
|---|---|---|---|
| Previous Owner | Dixon Marion L | $71,250 |
Source: Public Records
Tax History Compared to Growth
Tax History
| Year | Tax Paid | Tax Assessment Tax Assessment Total Assessment is a certain percentage of the fair market value that is determined by local assessors to be the total taxable value of land and additions on the property. | Land | Improvement |
|---|---|---|---|---|
| 2025 | $3,102 | $105,100 | $35,000 | $70,100 |
| 2024 | $3,102 | $90,400 | $35,000 | $55,400 |
| 2023 | $2,666 | $90,400 | $35,000 | $55,400 |
| 2022 | $2,916 | $90,400 | $35,000 | $55,400 |
| 2021 | $2,338 | $80,400 | $25,000 | $55,400 |
| 2020 | $2,338 | $80,400 | $25,000 | $55,400 |
| 2019 | $2,022 | $70,400 | $15,000 | $55,400 |
| 2018 | $1,942 | $70,400 | $15,000 | $55,400 |
| 2017 | $1,770 | $65,900 | $10,500 | $55,400 |
| 2016 | $1,594 | $61,900 | $6,500 | $55,400 |
| 2015 | $1,531 | $61,900 | $6,500 | $55,400 |
| 2014 | $1,523 | $67,500 | $7,500 | $60,000 |
Source: Public Records
Map
Nearby Homes
- 5086 Radnor Ct
- 5022 Laydon Ct
- 4944 Flintshire Ct
- 4930 Denbigh Ct
- 4922 Denbigh Ct
- 14 Strathmere Rd
- 3 Woodmere Ave
- 0 E Black Horse Unit 22520085
- 4830 Green Ash Ln Unit 287
- 4772 Summersweet Dr
- 2614 Dogwood Ct Unit 2614
- 1553 Madison Ct Unit 153
- 1544 Benjamin Franklin Ct
- 4915 Winterbury Dr Unit B14
- 1544 Ben Franklin Ct
- 4945 Rosebay Place Unit B17
- 1531 Hamilton Ct Unit 231
- 1531 Hamilton Ct
- 4944 Rosebay Place
- 1535 Benjamin Franklin Ct
- 5094 Radnor Ct
- 5092 Radnor Ct
- 5100 Radnor Ct
- 5102 Radnor Ct
- 5090 Radnor Ct
- 5104 Radnor Ct
- 5088 Radnor Ct
- 5084 Radnor Ct
- 5106 Radnor Ct
- 5118 Radnor Ct
- 5108 Radnor Ct Unit C2202
- 5082 Radnor Ct
- 5110 Radnor Ct
- 5112 Radnor Ct
- 5122 Radnor Ct
- 5080 Radnor Ct
- 5114 Radnor Ct
- 5124 Radnor Ct
- 5076 Radnor Ct
- 5116 Radnor Ct