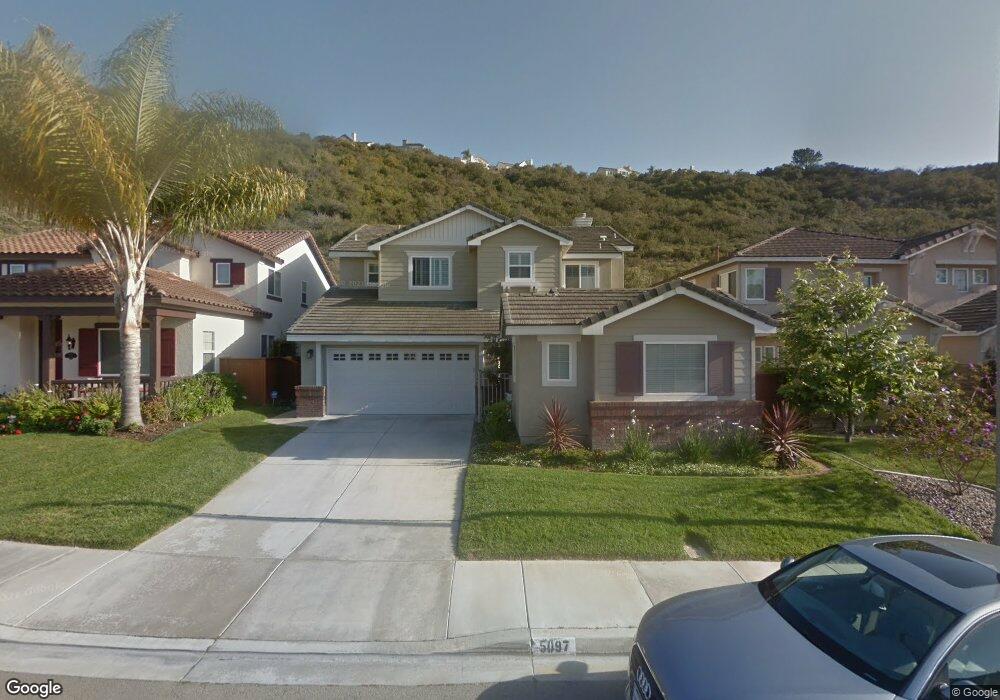
5097 Lynch Ct Carlsbad, CA 92008
Kelly Ranch NeighborhoodEstimated Value: $1,792,444 - $2,208,000
5
Beds
3
Baths
3,038
Sq Ft
$665/Sq Ft
Est. Value
About This Home
This home is located at 5097 Lynch Ct, Carlsbad, CA 92008 and is currently estimated at $2,021,111, approximately $665 per square foot. 5097 Lynch Ct is a home located in San Diego County with nearby schools including Kelly Elementary School, Sage Creek High, and Carlsbad High School.
Ownership History
Date
Name
Owned For
Owner Type
Purchase Details
Closed on
Apr 4, 2012
Sold by
Adishian Thomas K and Adishian Valentina
Bought by
Adishian Thomas K and Adishian Valentina
Current Estimated Value
Purchase Details
Closed on
Oct 30, 2002
Sold by
Tesoro Sean
Bought by
Adishian Thomas Kirk and Adishian Valentina
Home Financials for this Owner
Home Financials are based on the most recent Mortgage that was taken out on this home.
Original Mortgage
$479,200
Outstanding Balance
$198,794
Interest Rate
5.89%
Estimated Equity
$1,822,317
Purchase Details
Closed on
Mar 1, 2001
Sold by
Shea Homes Ltd Partnership
Bought by
Tesoro Sean
Home Financials for this Owner
Home Financials are based on the most recent Mortgage that was taken out on this home.
Original Mortgage
$385,300
Interest Rate
7.19%
Create a Home Valuation Report for This Property
The Home Valuation Report is an in-depth analysis detailing your home's value as well as a comparison with similar homes in the area
Home Values in the Area
Average Home Value in this Area
Purchase History
| Date | Buyer | Sale Price | Title Company |
|---|---|---|---|
| Adishian Thomas K | -- | None Available | |
| Adishian Thomas Kirk | $599,000 | Southland Title | |
| Tesoro Sean | $482,000 | First American Title |
Source: Public Records
Mortgage History
| Date | Status | Borrower | Loan Amount |
|---|---|---|---|
| Open | Adishian Thomas Kirk | $479,200 | |
| Previous Owner | Tesoro Sean | $385,300 | |
| Closed | Tesoro Sean | $72,250 | |
| Closed | Adishian Thomas Kirk | $59,900 |
Source: Public Records
Tax History Compared to Growth
Tax History
| Year | Tax Paid | Tax Assessment Tax Assessment Total Assessment is a certain percentage of the fair market value that is determined by local assessors to be the total taxable value of land and additions on the property. | Land | Improvement |
|---|---|---|---|---|
| 2025 | $9,837 | $867,533 | $434,490 | $433,043 |
| 2024 | $9,837 | $850,523 | $425,971 | $424,552 |
| 2023 | $9,790 | $833,847 | $417,619 | $416,228 |
| 2022 | $9,650 | $817,498 | $409,431 | $408,067 |
| 2021 | $9,582 | $801,469 | $401,403 | $400,066 |
| 2020 | $9,522 | $793,252 | $397,288 | $395,964 |
| 2019 | $9,364 | $777,699 | $389,499 | $388,200 |
| 2018 | $9,000 | $762,451 | $381,862 | $380,589 |
| 2017 | $8,863 | $747,502 | $374,375 | $373,127 |
| 2016 | $8,538 | $732,846 | $367,035 | $365,811 |
| 2015 | $8,506 | $721,839 | $361,522 | $360,317 |
| 2014 | $8,376 | $707,700 | $354,441 | $353,259 |
Source: Public Records
Map
Nearby Homes
- 5077 Ashberry Rd
- 5146 Delaney Ct
- 3438 Don Alberto Dr Unit 434
- 3466 Don Lorenzo Dr Unit 324
- 5115 Don Miguel Dr Unit 165
- 3462 Don Alberto Dr
- 3514 Don Juan Dr
- 3438 Don Ortega Dr
- 3445 Don Ortega Dr
- 5132 Don Rodolfo Dr
- 5459 Don Felipe Dr Unit 485
- 3473 Don Ortega Dr
- 2336 Summerwind Place
- 2273 Masters Rd
- 2364 Summerwind Place
- 4967 Cindy Ave
- 2289 Bryant Dr
- 3461 Alander Ct
- 2572 Chamomile Ln
- Plan 2212 Modeled at Coral Springs