
Landlord's Agent in 2024
Beth Hunter
Real Property Management Executives Greater Atlanta
(678) 765-8383
1 in this area
9 Total Sales
Estimated Value: $228,000 - $364,836
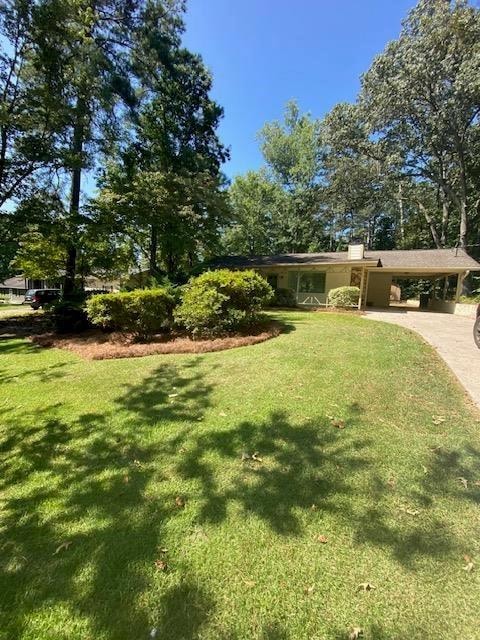
Welcome to this charming Ranch home in Sugar Hill, GA! NO Carpet! This cozy 3-bedroom, 2-bathroom house features hardwood floors, tile, new paint, and new flooring throughout. Relax and enjoy your Bright and Open Kitchen with New Refrigerator. Dining/Eat in Kitchen with tiled flooring. Family room with stone accent wall and Hardwood floors. The Owners Suite comes with a private bath for added convenience. Step outside and unwind on your patio overlooking the wooded private backyard. A big storage shed is available for all your storage needs, along with a smaller storage shed for you to use. Situated at the end of the street, this home offers a sense of privacy and tranquility. Don't miss out on this lovely home with updated features and a peaceful setting. Close to interstates, shopping, dining, Hwy 20, Lake Lanier, Mall of GA, Sugar Hill Epic Center, Amphitheater, and EE Robinson Park, this home is in a prime location for entertainment and convenience.
Last Agent to Rent the Property
Real Property Management Executives Greater Atlanta License #207872 Listed on: 08/13/2024
Last Renter's Agent
Real Property Management Executives Greater Atlanta License #207872 Listed on: 08/13/2024
| Date | Buyer | Sale Price | Title Company |
|---|---|---|---|
| Jersey South Investments Llc | $232,500 | -- | |
| Morrell Maureen A | -- | -- | |
| Morrell Maureen | $67,100 | -- |
| Date | Status | Borrower | Loan Amount |
|---|---|---|---|
| Previous Owner | Morrell Maureen | $53,680 |
| Date | Event | Price | List to Sale | Price per Sq Ft | Prior Sale |
|---|---|---|---|---|---|
| 10/15/2024 10/15/24 | Rented | $1,695 | 0.0% | -- | |
| 10/15/2024 10/15/24 | Under Contract | -- | -- | -- | |
| 09/30/2024 09/30/24 | Price Changed | $1,695 | -5.6% | $1 / Sq Ft | |
| 09/24/2024 09/24/24 | Price Changed | $1,795 | -5.3% | $1 / Sq Ft | |
| 09/10/2024 09/10/24 | Price Changed | $1,895 | -2.8% | $1 / Sq Ft | |
| 09/03/2024 09/03/24 | Price Changed | $1,950 | -2.3% | $2 / Sq Ft | |
| 08/19/2024 08/19/24 | Price Changed | $1,995 | -9.1% | $2 / Sq Ft | |
| 08/13/2024 08/13/24 | For Rent | $2,195 | +99.5% | -- | |
| 09/16/2016 09/16/16 | Rented | $1,100 | 0.0% | -- | |
| 09/15/2016 09/15/16 | Under Contract | -- | -- | -- | |
| 08/24/2016 08/24/16 | Price Changed | $1,100 | -3.9% | $1 / Sq Ft | |
| 08/21/2016 08/21/16 | Price Changed | $1,145 | -8.4% | $1 / Sq Ft | |
| 08/10/2016 08/10/16 | For Rent | $1,250 | +13.6% | -- | |
| 02/22/2013 02/22/13 | Rented | -- | -- | -- | |
| 02/22/2013 02/22/13 | For Rent | $1,100 | 0.0% | -- | |
| 09/28/2012 09/28/12 | Sold | $67,100 | +3.2% | $53 / Sq Ft | View Prior Sale |
| 08/29/2012 08/29/12 | Pending | -- | -- | -- | |
| 08/07/2012 08/07/12 | For Sale | $65,000 | -- | $51 / Sq Ft |
| Year | Tax Paid | Tax Assessment Tax Assessment Total Assessment is a certain percentage of the fair market value that is determined by local assessors to be the total taxable value of land and additions on the property. | Land | Improvement |
|---|---|---|---|---|
| 2025 | $4,244 | $110,960 | $28,000 | $82,960 |
| 2024 | $4,319 | $111,840 | $28,000 | $83,840 |
| 2023 | $4,319 | $105,120 | $28,000 | $77,120 |
| 2022 | $3,653 | $94,160 | $22,000 | $72,160 |
| 2021 | $2,880 | $71,360 | $16,000 | $55,360 |
| 2020 | $2,896 | $71,360 | $16,000 | $55,360 |
| 2019 | $2,551 | $64,400 | $16,000 | $48,400 |
| 2018 | $1,977 | $48,080 | $12,000 | $36,080 |
| 2016 | $1,996 | $48,080 | $12,000 | $36,080 |
| 2015 | $1,604 | $36,520 | $7,160 | $29,360 |
| 2014 | -- | $36,520 | $7,160 | $29,360 |
Landlord's Agent in 2024
Beth Hunter
Real Property Management Executives Greater Atlanta
(678) 765-8383
1 in this area
9 Total Sales
Seller Co-Listing Agent in 2016
Tim Grizzle
Real Property Management Executives Greater Atlanta
(770) 789-7901
1 Total Sale
S
Seller's Agent in 2013
Shannon Washington
NOT A VALID MEMBER
Seller's Agent in 2012
Connie Lawson
RE/MAX
(770) 318-0458
125 Total Sales
S
Buyer's Agent in 2012
SARAH STATON
NOT A VALID MEMBER
Source: First Multiple Listing Service (FMLS)
MLS Number: 7438363
APN: 7-290-119
Disclaimer: Certain information contained herein is derived from information provided by parties other than Homes.com. All information provided is deemed reliable, but is not guaranteed to be accurate and should be independently verified.
![]() Listings identified with the FMLS IDX logo come from FMLS and are held by brokerage firms other than the owner of this website. The listing brokerage is identified in any listing details. Information is deemed reliable but is not guaranteed. If you believe any FMLS listing contains material that infringes your copyrighted work please visit www.fmls.com/dmca to review our DMCA policy and learn how to submit a takedown request. © 2025 First Multiple Listing Service, Inc.
Listings identified with the FMLS IDX logo come from FMLS and are held by brokerage firms other than the owner of this website. The listing brokerage is identified in any listing details. Information is deemed reliable but is not guaranteed. If you believe any FMLS listing contains material that infringes your copyrighted work please visit www.fmls.com/dmca to review our DMCA policy and learn how to submit a takedown request. © 2025 First Multiple Listing Service, Inc.