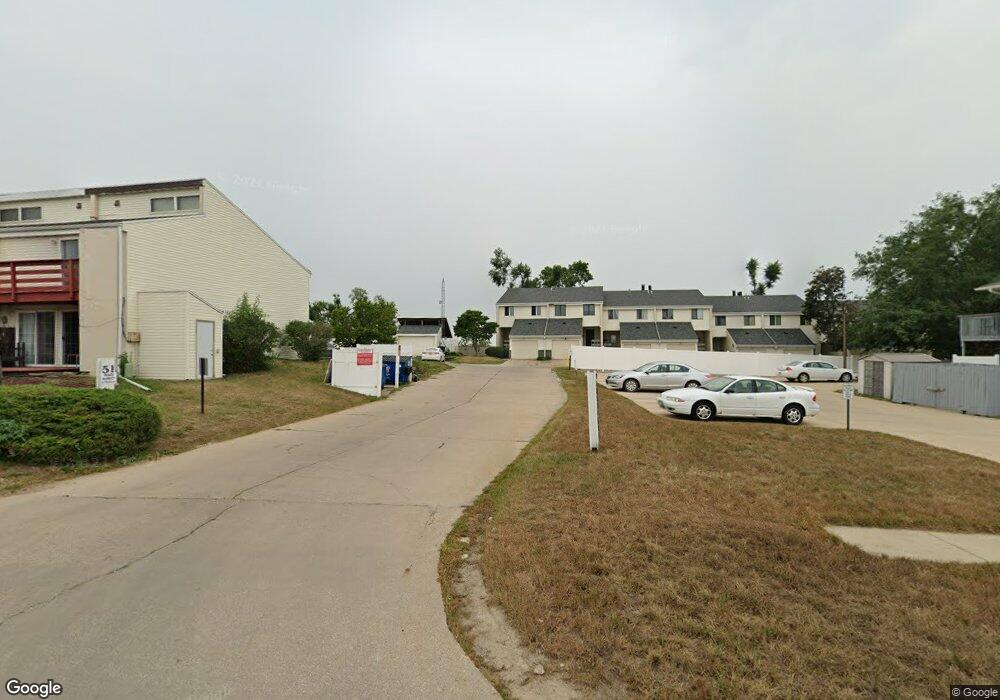
51 29th Avenue Dr SW Cedar Rapids, IA 52404
Southwest Area NeighborhoodEstimated Value: $135,000 - $141,000
3
Beds
1
Bath
1,080
Sq Ft
$128/Sq Ft
Est. Value
About This Home
This home is located at 51 29th Avenue Dr SW, Cedar Rapids, IA 52404 and is currently estimated at $137,840, approximately $127 per square foot. 51 29th Avenue Dr SW is a home located in Linn County with nearby schools including Prairie Heights Elementary School, Prairie Crest Elementary School, and Prairie View Elementary School.
Ownership History
Date
Name
Owned For
Owner Type
Purchase Details
Closed on
Jun 6, 2023
Sold by
Shrader Esther Marie and Shrader Thomas G
Bought by
Shrader Sherry
Current Estimated Value
Purchase Details
Closed on
Mar 20, 2020
Sold by
Ready Jennifer Ann and Mrsik Troy
Bought by
Corridor Property Solutions Llc
Home Financials for this Owner
Home Financials are based on the most recent Mortgage that was taken out on this home.
Original Mortgage
$88,050
Interest Rate
3.4%
Mortgage Type
Future Advance Clause Open End Mortgage
Purchase Details
Closed on
Jun 27, 2013
Sold by
Kenney Shirl
Bought by
Mrstik Jennifer and Mrstik Troy
Home Financials for this Owner
Home Financials are based on the most recent Mortgage that was taken out on this home.
Original Mortgage
$94,000
Interest Rate
3.83%
Mortgage Type
New Conventional
Purchase Details
Closed on
Nov 22, 2005
Sold by
Kenney Shirl
Bought by
Kenney Shirl and The Shirl Kenney Revocable Trust
Create a Home Valuation Report for This Property
The Home Valuation Report is an in-depth analysis detailing your home's value as well as a comparison with similar homes in the area
Home Values in the Area
Average Home Value in this Area
Purchase History
| Date | Buyer | Sale Price | Title Company |
|---|---|---|---|
| Shrader Sherry | -- | None Listed On Document | |
| Corridor Property Solutions Llc | $98,000 | None Available | |
| Mrstik Jennifer | $99,000 | None Available | |
| Kenney Shirl | -- | -- |
Source: Public Records
Mortgage History
| Date | Status | Borrower | Loan Amount |
|---|---|---|---|
| Previous Owner | Corridor Property Solutions Llc | $88,050 | |
| Previous Owner | Mrstik Jennifer | $94,000 |
Source: Public Records
Tax History Compared to Growth
Tax History
| Year | Tax Paid | Tax Assessment Tax Assessment Total Assessment is a certain percentage of the fair market value that is determined by local assessors to be the total taxable value of land and additions on the property. | Land | Improvement |
|---|---|---|---|---|
| 2025 | $1,818 | $122,200 | $18,000 | $104,200 |
| 2024 | $2,038 | $106,400 | $13,000 | $93,400 |
| 2023 | $2,038 | $106,400 | $13,000 | $93,400 |
| 2022 | $2,060 | $100,900 | $13,000 | $87,900 |
| 2021 | $2,156 | $94,800 | $13,000 | $81,800 |
| 2020 | $2,156 | $94,700 | $13,000 | $81,700 |
| 2019 | $1,888 | $92,700 | $13,000 | $79,700 |
| 2018 | $1,674 | $92,700 | $13,000 | $79,700 |
| 2017 | $1,698 | $84,000 | $7,000 | $77,000 |
| 2016 | $2,097 | $96,900 | $7,000 | $89,900 |
| 2015 | $2,093 | $97,277 | $7,000 | $90,277 |
| 2014 | $1,906 | $94,622 | $7,000 | $87,622 |
| 2013 | $1,752 | $94,622 | $7,000 | $87,622 |
Source: Public Records
Map
Nearby Homes
- 2955 Bowling St SW Unit E238
- 51 29th Avenue Dr SW Unit D11
- 51 29th Avenue Dr SW Unit C22
- 3010 Bowling St SW
- 109 Evelyn Dr SW
- 42 Park Village Ave SW
- 2937 Southland St SW
- 2818 Southland St SW
- 3212 Southland St SW
- 9 33rd Ave SW
- 2601 Teresa Dr SW
- 90 29th Ave SW
- 148 33rd Ave SW
- 2321 Lauren Dr SW
- 2212 Deborah Dr SW
- 186 22nd Ave SW
- 2021 Hamilton St SW
- Lot A-D 41st Avenue Dr SW
- 2536 L St SW
- 1804 I St SW
- 51 29th Avenue Dr SW Unit 2
- 51 29th Avenue Dr SW
- 51 29th Avenue Dr SW
- 51 29th Avenue Dr SW Unit 20
- 51 29th Avenue Dr SW Unit C19
- 51 29th Avenue Dr SW
- 51 29th Avenue Dr SW Unit C17
- 51 29th Avenue Dr SW
- 51 29th Avenue Dr SW Unit D14
- 51 29th Avenue Dr SW Unit D11
- 51 29th Avenue Dr SW Unit 10
- 51 29th Avenue Dr SW Unit 9
- 51 29th Avenue Dr SW
- 51 29th Avenue Dr SW Unit 7
- 51 29th Avenue Dr SW Unit 6
- 51 29th Avenue Dr SW Unit B5
- 51 29th Avenue Dr SW Unit B4
- 51 29th Avenue Dr SW Unit B3
- 51 29th Avenue Dr SW
- 51 29th Avenue Dr SW Unit B1