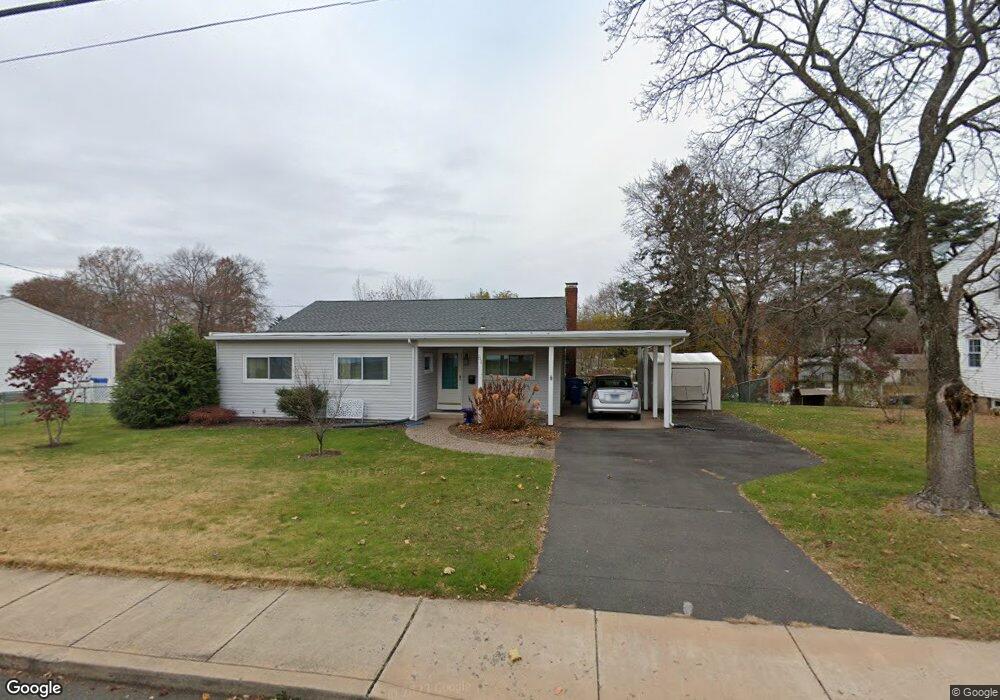
51 Arcellia Dr Manchester, CT 06042
Buckley District NeighborhoodEstimated Value: $294,000 - $320,889
2
Beds
2
Baths
1,225
Sq Ft
$251/Sq Ft
Est. Value
About This Home
This home is located at 51 Arcellia Dr, Manchester, CT 06042 and is currently estimated at $307,222, approximately $250 per square foot. 51 Arcellia Dr is a home located in Hartford County with nearby schools including Buckley School, Illing Middle School, and Elisabeth M. Bennet Academy.
Ownership History
Date
Name
Owned For
Owner Type
Purchase Details
Closed on
Oct 14, 2005
Sold by
Cosper Phillip D
Bought by
Ward Joan H
Current Estimated Value
Home Financials for this Owner
Home Financials are based on the most recent Mortgage that was taken out on this home.
Original Mortgage
$60,000
Outstanding Balance
$32,155
Interest Rate
5.78%
Estimated Equity
$275,067
Purchase Details
Closed on
Jul 21, 1998
Sold by
Skoog-Mcaugan Sandra
Bought by
Cooper Philip D
Purchase Details
Closed on
Jun 23, 1989
Sold by
Skoog Barbara A
Bought by
Skoog Sandra L
Create a Home Valuation Report for This Property
The Home Valuation Report is an in-depth analysis detailing your home's value as well as a comparison with similar homes in the area
Home Values in the Area
Average Home Value in this Area
Purchase History
| Date | Buyer | Sale Price | Title Company |
|---|---|---|---|
| Ward Joan H | $182,000 | -- | |
| Ward Joan H | $182,000 | -- | |
| Cooper Philip D | $103,000 | -- | |
| Skoog Sandra L | $130,000 | -- |
Source: Public Records
Mortgage History
| Date | Status | Borrower | Loan Amount |
|---|---|---|---|
| Closed | Skoog Sandra L | $25,000 | |
| Open | Skoog Sandra L | $60,000 |
Source: Public Records
Tax History Compared to Growth
Tax History
| Year | Tax Paid | Tax Assessment Tax Assessment Total Assessment is a certain percentage of the fair market value that is determined by local assessors to be the total taxable value of land and additions on the property. | Land | Improvement |
|---|---|---|---|---|
| 2025 | $5,423 | $136,200 | $39,100 | $97,100 |
| 2024 | $5,268 | $136,200 | $39,100 | $97,100 |
| 2023 | $5,067 | $136,200 | $39,100 | $97,100 |
| 2022 | $4,920 | $136,200 | $39,100 | $97,100 |
| 2021 | $4,457 | $106,300 | $33,600 | $72,700 |
| 2020 | $4,451 | $106,300 | $33,600 | $72,700 |
| 2019 | $4,433 | $106,300 | $33,600 | $72,700 |
| 2018 | $4,349 | $106,300 | $33,600 | $72,700 |
| 2017 | $4,225 | $106,300 | $33,600 | $72,700 |
| 2016 | $4,480 | $112,900 | $42,700 | $70,200 |
| 2015 | $4,448 | $112,900 | $42,700 | $70,200 |
| 2014 | $4,364 | $112,900 | $42,700 | $70,200 |
Source: Public Records
Map
Nearby Homes