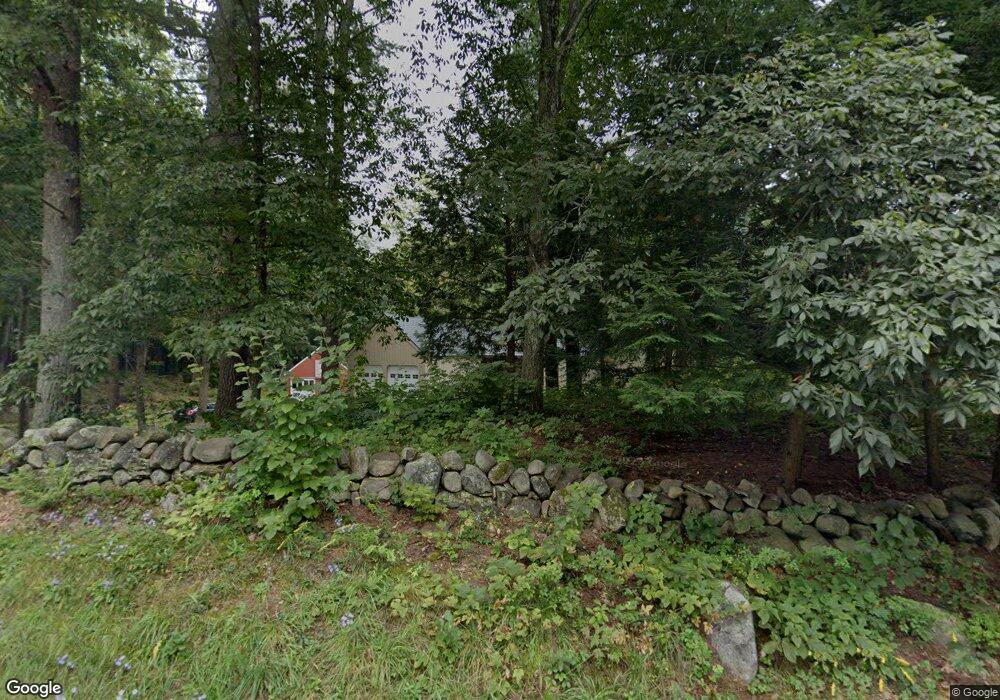
51 Baxter Rd Hollis, NH 03049
Hollis NeighborhoodEstimated Value: $632,000 - $758,000
3
Beds
3
Baths
2,028
Sq Ft
$352/Sq Ft
Est. Value
About This Home
This home is located at 51 Baxter Rd, Hollis, NH 03049 and is currently estimated at $713,984, approximately $352 per square foot. 51 Baxter Rd is a home with nearby schools including Hollis Primary School, Hollis Upper Elementary School, and Hollis-Brookline Middle School.
Ownership History
Date
Name
Owned For
Owner Type
Purchase Details
Closed on
Mar 27, 2008
Sold by
Us Bank Na
Bought by
Bergeron Danny J and Bergeron Laura L
Current Estimated Value
Purchase Details
Closed on
Oct 3, 2007
Sold by
Bensinger Richard B
Bought by
Us Bank Na
Purchase Details
Closed on
Jun 19, 1998
Sold by
Meyers James B and Meyers Robbin J
Bought by
Besinger Richard B
Create a Home Valuation Report for This Property
The Home Valuation Report is an in-depth analysis detailing your home's value as well as a comparison with similar homes in the area
Home Values in the Area
Average Home Value in this Area
Purchase History
| Date | Buyer | Sale Price | Title Company |
|---|---|---|---|
| Bergeron Danny J | $321,000 | -- | |
| Us Bank Na | $442,600 | -- | |
| Besinger Richard B | $240,000 | -- |
Source: Public Records
Mortgage History
| Date | Status | Borrower | Loan Amount |
|---|---|---|---|
| Open | Besinger Richard B | $49,000 | |
| Open | Besinger Richard B | $258,750 |
Source: Public Records
Tax History Compared to Growth
Tax History
| Year | Tax Paid | Tax Assessment Tax Assessment Total Assessment is a certain percentage of the fair market value that is determined by local assessors to be the total taxable value of land and additions on the property. | Land | Improvement |
|---|---|---|---|---|
| 2024 | $10,360 | $584,300 | $252,000 | $332,300 |
| 2023 | $9,734 | $584,300 | $252,000 | $332,300 |
| 2022 | $13,188 | $584,300 | $252,000 | $332,300 |
| 2021 | $8,594 | $378,600 | $164,800 | $213,800 |
| 2020 | $8,776 | $378,600 | $164,800 | $213,800 |
| 2019 | $8,746 | $378,600 | $164,800 | $213,800 |
| 2018 | $7,283 | $378,600 | $164,800 | $213,800 |
| 2017 | $7,327 | $316,500 | $144,800 | $171,700 |
| 2016 | $7,416 | $316,500 | $144,800 | $171,700 |
| 2015 | $7,286 | $316,500 | $144,800 | $171,700 |
| 2014 | $7,321 | $316,500 | $144,800 | $171,700 |
| 2013 | $7,314 | $320,500 | $144,800 | $175,700 |
Source: Public Records
Map
Nearby Homes
- 40-40A Pine Hill Rd
- 45 Long Hill Rd
- 199 Pine Hill Rd
- 118 Broad St
- 77 Broad St
- 4-13 Woodmont Dr
- 206 S Merrimack Rd
- 3 Wood Ln
- 10 Pilgrim Cir
- 8 Pilgrim Cir
- 77 Mooar Hill Rd
- 334 Broad St
- 7 Lovejoy Ln
- 95 Wright Rd
- 22 Cathedral Cir
- 91 Deacon Ln
- 11 Rideout Rd
- 172 Hayden Rd
- 28 Bartemus Trail Unit U210
- 14 Parrish Hill Dr