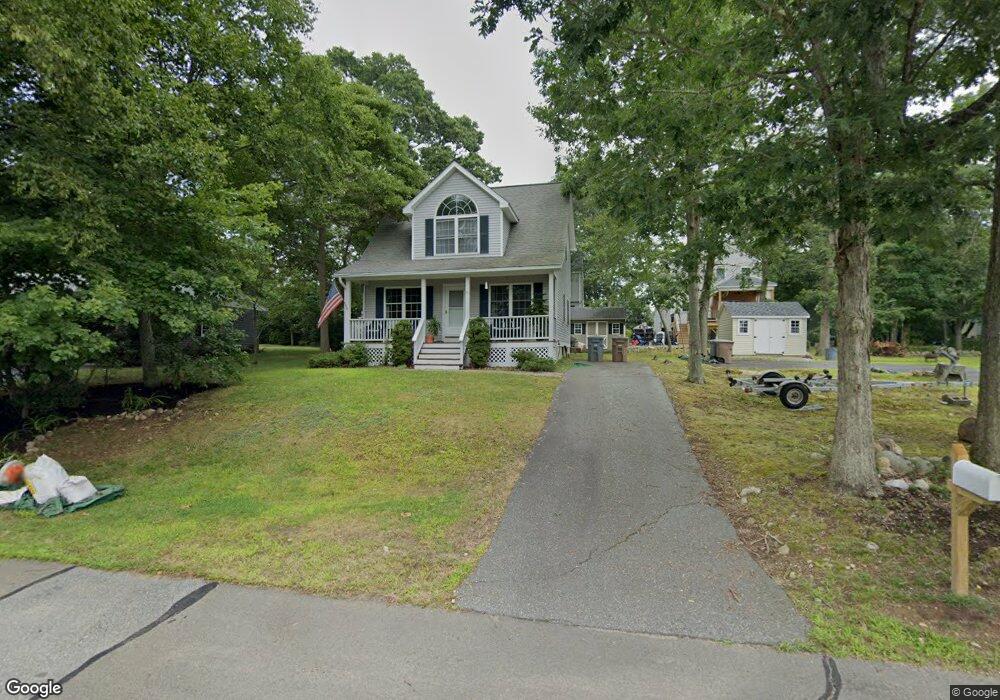
51 Bayview Rd Niantic, CT 06357
Estimated Value: $490,693 - $579,000
3
Beds
2
Baths
1,336
Sq Ft
$410/Sq Ft
Est. Value
About This Home
This home is located at 51 Bayview Rd, Niantic, CT 06357 and is currently estimated at $548,173, approximately $410 per square foot. 51 Bayview Rd is a home located in New London County with nearby schools including East Lyme Middle School, East Lyme High School, and The Light House Voc-Ed Center.
Ownership History
Date
Name
Owned For
Owner Type
Purchase Details
Closed on
Jul 28, 1999
Sold by
Majewski Anthony J Est and Majewski
Bought by
Mazzarella Salvatore
Current Estimated Value
Purchase Details
Closed on
Jul 2, 1997
Sold by
Mazzarella Salvatore
Bought by
Debernoardo Scott P and Maguire Beth M
Home Financials for this Owner
Home Financials are based on the most recent Mortgage that was taken out on this home.
Original Mortgage
$120,000
Interest Rate
7.86%
Mortgage Type
Unknown
Create a Home Valuation Report for This Property
The Home Valuation Report is an in-depth analysis detailing your home's value as well as a comparison with similar homes in the area
Home Values in the Area
Average Home Value in this Area
Purchase History
| Date | Buyer | Sale Price | Title Company |
|---|---|---|---|
| Mazzarella Salvatore | $30,000 | -- | |
| Debernoardo Scott P | $130,000 | -- |
Source: Public Records
Mortgage History
| Date | Status | Borrower | Loan Amount |
|---|---|---|---|
| Open | Debernoardo Scott P | $132,000 | |
| Closed | Debernoardo Scott P | $102,278 | |
| Previous Owner | Debernoardo Scott P | $120,000 |
Source: Public Records
Tax History
| Year | Tax Paid | Tax Assessment Tax Assessment Total Assessment is a certain percentage of the fair market value that is determined by local assessors to be the total taxable value of land and additions on the property. | Land | Improvement |
|---|---|---|---|---|
| 2025 | $5,802 | $207,130 | $77,630 | $129,500 |
| 2024 | $5,458 | $207,130 | $77,630 | $129,500 |
| 2023 | $5,153 | $207,130 | $77,630 | $129,500 |
| 2022 | $4,938 | $207,130 | $77,630 | $129,500 |
| 2021 | $4,608 | $161,630 | $70,210 | $91,420 |
| 2020 | $4,584 | $161,630 | $70,210 | $91,420 |
| 2019 | $4,556 | $161,630 | $70,210 | $91,420 |
| 2018 | $4,421 | $161,630 | $70,210 | $91,420 |
| 2017 | $4,228 | $161,630 | $70,210 | $91,420 |
| 2016 | $4,005 | $157,920 | $66,500 | $91,420 |
| 2015 | $3,902 | $157,920 | $66,500 | $91,420 |
| 2014 | $3,795 | $157,920 | $66,500 | $91,420 |
Source: Public Records
Map
Nearby Homes
- 15 Griswold Rd
- 12 Spinnaker Dr
- 22 Riverdale Landing
- 19 Sapia Dr
- 86 Corey Ln
- 2 Riverdale Landing
- 26 Mohawk Dr
- 15 Freedom Way Unit 105
- 15 Freedom Way Unit 92
- 127 Black Point Rd Unit 7
- 55 Corey Ln
- 36 Attawan Rd
- 61 Whitecap Rd
- 43 Roxbury Ct
- 97 W Main St Unit 36
- 14 Colton Rd
- 42 S Washington Ave
- 47 Village Crossing Unit 47
- 46 Village Crossing Unit 46
- 188 4 Mile River Rd
Your Personal Tour Guide
Ask me questions while you tour the home.