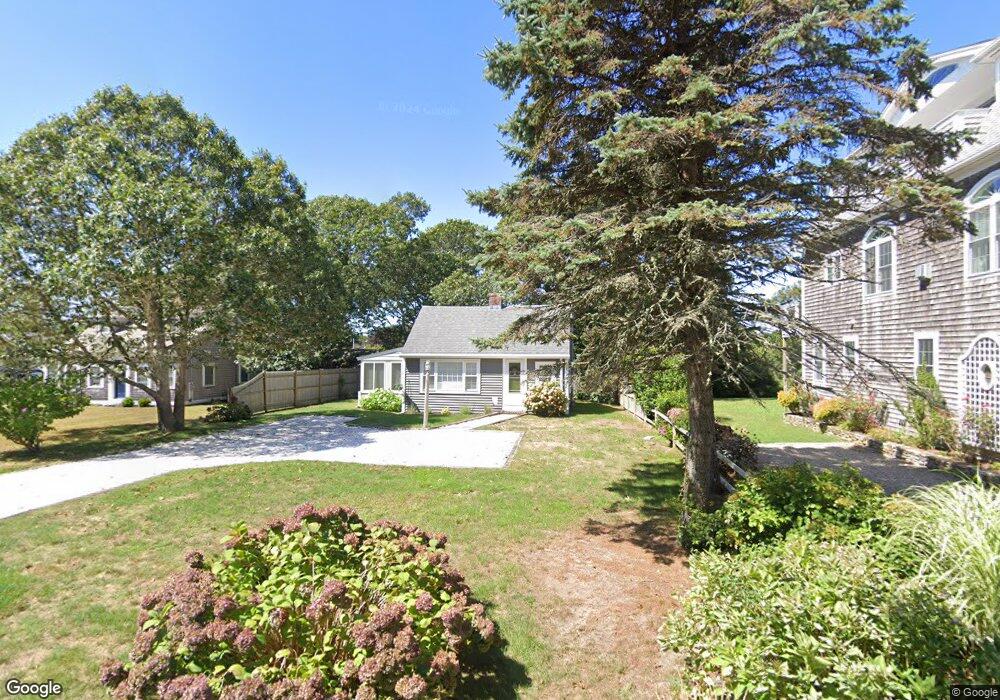
51 Caleb St Dennis Port, MA 2639
Dennis Port NeighborhoodEstimated Value: $570,000 - $619,000
3
Beds
1
Bath
800
Sq Ft
$737/Sq Ft
Est. Value
About This Home
This home is located at 51 Caleb St, Dennis Port, MA 2639 and is currently estimated at $589,484, approximately $736 per square foot. 51 Caleb St is a home located in Barnstable County with nearby schools including Dennis-Yarmouth Regional High School and St. Pius X. School.
Ownership History
Date
Name
Owned For
Owner Type
Purchase Details
Closed on
Jul 6, 1999
Sold by
Dimodica Michael J and Dimodica Kathryn F
Bought by
Drewnowski Michael W and Drewnowski Donna M
Current Estimated Value
Home Financials for this Owner
Home Financials are based on the most recent Mortgage that was taken out on this home.
Original Mortgage
$89,600
Interest Rate
7.19%
Mortgage Type
Purchase Money Mortgage
Create a Home Valuation Report for This Property
The Home Valuation Report is an in-depth analysis detailing your home's value as well as a comparison with similar homes in the area
Home Values in the Area
Average Home Value in this Area
Purchase History
| Date | Buyer | Sale Price | Title Company |
|---|---|---|---|
| Drewnowski Michael W | $112,000 | -- |
Source: Public Records
Mortgage History
| Date | Status | Borrower | Loan Amount |
|---|---|---|---|
| Open | Drewnowski Michael W | $87,500 | |
| Closed | Drewnowski Michael W | $89,600 |
Source: Public Records
Tax History Compared to Growth
Tax History
| Year | Tax Paid | Tax Assessment Tax Assessment Total Assessment is a certain percentage of the fair market value that is determined by local assessors to be the total taxable value of land and additions on the property. | Land | Improvement |
|---|---|---|---|---|
| 2025 | $2,431 | $561,500 | $326,100 | $235,400 |
| 2024 | $2,286 | $520,700 | $313,600 | $207,100 |
| 2023 | $2,211 | $473,500 | $285,100 | $188,400 |
| 2022 | $2,036 | $363,600 | $224,700 | $138,900 |
| 2021 | $1,977 | $327,800 | $220,300 | $107,500 |
| 2020 | $1,963 | $321,800 | $220,300 | $101,500 |
| 2019 | $2,020 | $327,400 | $234,500 | $92,900 |
| 2018 | $14,434 | $310,900 | $223,200 | $87,700 |
| 2017 | $1,804 | $293,300 | $205,600 | $87,700 |
| 2016 | $1,739 | $266,300 | $193,900 | $72,400 |
| 2015 | $1,704 | $266,300 | $193,900 | $72,400 |
| 2014 | $1,587 | $249,900 | $182,100 | $67,800 |
Source: Public Records
Map
Nearby Homes
- 1 Belmont Rd Unit 630
- 1 Belmont Rd Unit 513
- 1 E Belmont Unit 630
- 26 Manning Rd
- 3 Fairbanks Dr
- 11 Ocean Park W
- 159 Center St Unit 22
- 9 Chase Ave Unit 6
- 73 Division St
- 148 Belmont Rd
- 12 Cross St
- 19 Riverway
- 19 Riverway
- 402 Old Wharf Rd
- 402 Old Wharf Rd
- 405 Old Wharf Rd Unit B204
- 405 Old Wharf Rd Unit B204
- 24 Chase St
- 40 Willow St
- 24 Chase St