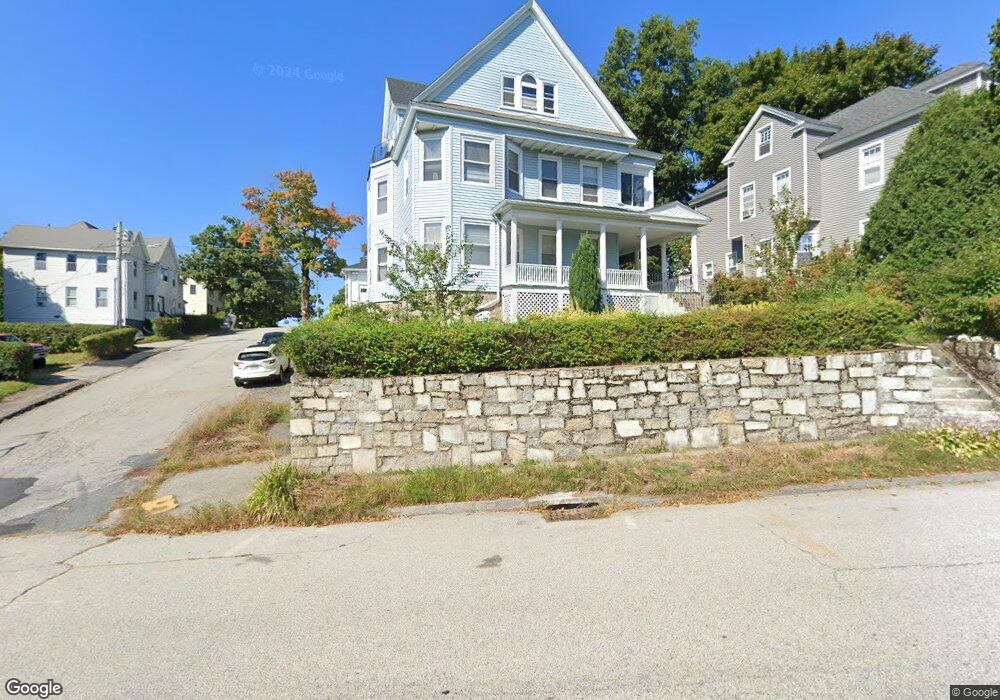
51 Channing St Worcester, MA 01605
Brittan Square NeighborhoodEstimated Value: $506,221 - $798,000
8
Beds
3
Baths
5,034
Sq Ft
$132/Sq Ft
Est. Value
About This Home
This home is located at 51 Channing St, Worcester, MA 01605 and is currently estimated at $662,055, approximately $131 per square foot. 51 Channing St is a home located in Worcester County with nearby schools including Jacob Hiatt Magnet School, Chandler Magnet, and Burncoat Middle School.
Ownership History
Date
Name
Owned For
Owner Type
Purchase Details
Closed on
Oct 21, 2004
Sold by
Pearson Kurt E and Pearson Polly C
Bought by
Li Lan and Cui Yingfang
Current Estimated Value
Home Financials for this Owner
Home Financials are based on the most recent Mortgage that was taken out on this home.
Original Mortgage
$215,920
Outstanding Balance
$107,507
Interest Rate
5.85%
Mortgage Type
Purchase Money Mortgage
Estimated Equity
$554,548
Create a Home Valuation Report for This Property
The Home Valuation Report is an in-depth analysis detailing your home's value as well as a comparison with similar homes in the area
Home Values in the Area
Average Home Value in this Area
Purchase History
| Date | Buyer | Sale Price | Title Company |
|---|---|---|---|
| Li Lan | $269,900 | -- |
Source: Public Records
Mortgage History
| Date | Status | Borrower | Loan Amount |
|---|---|---|---|
| Open | Li Lan | $215,920 |
Source: Public Records
Tax History
| Year | Tax Paid | Tax Assessment Tax Assessment Total Assessment is a certain percentage of the fair market value that is determined by local assessors to be the total taxable value of land and additions on the property. | Land | Improvement |
|---|---|---|---|---|
| 2025 | $9,221 | $699,100 | $84,700 | $614,400 |
| 2024 | $8,951 | $651,000 | $84,700 | $566,300 |
| 2023 | $8,293 | $578,300 | $73,700 | $504,600 |
| 2022 | $7,477 | $491,600 | $59,000 | $432,600 |
| 2021 | $6,248 | $383,800 | $47,200 | $336,600 |
| 2020 | $4,978 | $292,800 | $46,800 | $246,000 |
| 2019 | $5,164 | $286,900 | $40,900 | $246,000 |
| 2018 | $5,231 | $276,600 | $40,900 | $235,700 |
| 2017 | $4,938 | $256,900 | $40,900 | $216,000 |
| 2016 | $4,854 | $235,500 | $29,800 | $205,700 |
| 2015 | $4,726 | $235,500 | $29,800 | $205,700 |
| 2014 | $4,602 | $235,500 | $29,800 | $205,700 |
Source: Public Records
Map
Nearby Homes
- 26 Orne St
- 78 Green Hill Pkwy
- 176 Lincoln St Unit 4
- 139 Lincoln St
- 15 Breck St
- 249 Lincoln St
- Lot 2 Ararat
- 33 Denmark St
- 51 Uxbridge St
- 91 Stanton St
- 27 Harlow St
- 26 Vinson St
- 145 Eastern Ave
- 21 Kendall St
- 15 Edward St
- 2 Selden St
- 256 Belmont St
- 63 North St Unit D
- 63 North St Unit C
- 63 North St Unit B
- 28 Windsor St
- 40 Perkins St
- 55 Channing St
- 30 Windsor St
- 48 Forbes St
- 48 Forbes St Unit 3
- 26 Windsor St
- 57 Channing St
- 32 Windsor St
- 49 Channing St
- 38 Parsons St
- 24 Windsor St
- 29 Windsor St
- 29 Windsor St Unit 2
- 27 Windsor St
- 27 Windsor St Unit 2
- 27 Windsor St
- 27 Windsor St Unit 1L
- 34 Perkins St
- 47 Channing St
Your Personal Tour Guide
Ask me questions while you tour the home.