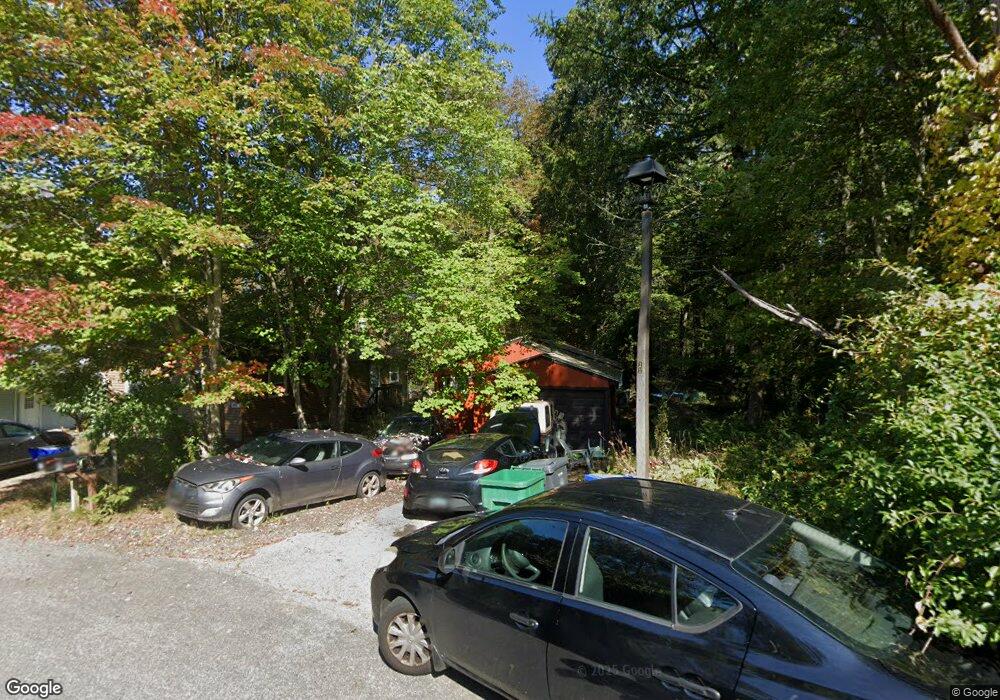
51 Chetelat Dr Ashford, CT 06278
Estimated Value: $189,000 - $319,000
2
Beds
1
Bath
864
Sq Ft
$272/Sq Ft
Est. Value
About This Home
This home is located at 51 Chetelat Dr, Ashford, CT 06278 and is currently estimated at $234,631, approximately $271 per square foot. 51 Chetelat Dr is a home located in Windham County with nearby schools including Ashford School and E.O. Smith High School.
Ownership History
Date
Name
Owned For
Owner Type
Purchase Details
Closed on
May 3, 2010
Sold by
Lackey-Russi Patricia
Bought by
Russi Julia F and Lackey-Russi Patrica A
Current Estimated Value
Purchase Details
Closed on
Sep 27, 1995
Sold by
Craig John D and Craig Karen L
Bought by
Lockey Patricia A and Russi Margaret
Create a Home Valuation Report for This Property
The Home Valuation Report is an in-depth analysis detailing your home's value as well as a comparison with similar homes in the area
Home Values in the Area
Average Home Value in this Area
Purchase History
| Date | Buyer | Sale Price | Title Company |
|---|---|---|---|
| Russi Julia F | -- | -- | |
| Russi Julia F | -- | -- | |
| Lockey Patricia A | $59,000 | -- | |
| Lockey Patricia A | $59,000 | -- |
Source: Public Records
Mortgage History
| Date | Status | Borrower | Loan Amount |
|---|---|---|---|
| Previous Owner | Lockey Patricia A | $77,600 | |
| Previous Owner | Lockey Patricia A | $58,439 |
Source: Public Records
Tax History Compared to Growth
Tax History
| Year | Tax Paid | Tax Assessment Tax Assessment Total Assessment is a certain percentage of the fair market value that is determined by local assessors to be the total taxable value of land and additions on the property. | Land | Improvement |
|---|---|---|---|---|
| 2025 | $2,457 | $67,550 | $22,680 | $44,870 |
| 2024 | $2,321 | $67,550 | $22,680 | $44,870 |
| 2023 | $2,235 | $67,550 | $22,680 | $44,870 |
| 2022 | $2,180 | $67,550 | $22,680 | $44,870 |
| 2021 | $2,368 | $65,100 | $23,700 | $41,400 |
| 2020 | $2,398 | $65,100 | $23,700 | $41,400 |
| 2019 | $2,308 | $65,100 | $23,700 | $41,400 |
| 2018 | $2,264 | $65,100 | $23,700 | $41,400 |
| 2017 | $2,237 | $65,100 | $23,700 | $41,400 |
| 2016 | $2,437 | $75,300 | $28,100 | $47,200 |
| 2015 | $2,482 | $75,300 | $28,100 | $47,200 |
| 2014 | $2,422 | $75,300 | $28,100 | $47,200 |
Source: Public Records
Map
Nearby Homes
- 94 Mansfield Rd
- 90-94 & 93 Upton Rd
- 102 Krapf Rd
- 150 Krapf Rd
- 685 Wormwood Hill Rd
- 66 Bebbington Rd
- 173 Westford Hill Rd
- 0 Chatey Rd
- 283 Tower Hill Rd
- 77 Lakeside Dr
- 241 Wormwood Hill Rd
- 164 Tower Hill Rd
- 0 Jared Sparks Rd
- 22 Red Oak Hill Rd
- 329 Turnpike Rd
- 29 General Lyon Rd
- 368 Warrenville Rd
- 16 Pilfershire Rd
- 60 Chaplin St
- 674 Middle Turnpike
- 49 Chetelat Dr
- 59 Chetelat Dr
- 47 Chetelat Dr
- 45 Chetelat Dr
- 63 Chetelat Dr
- 64 Chetelat Dr
- 20 Chetelat Dr
- 43 Chetelat Dr
- 67 Chetelat Dr
- 41 Chetelat Dr
- 37 Chetelat Dr
- 7 Kent Ct Unit 2
- 7 Kent Ct Unit 1
- 7 Kent Ct Unit 3
- 7 Kent Ct Unit 4
- 7 Kent Ct Unit 7-1
- 7 Kent Ct Unit 36
- 7 Kent Ct Unit 7-2
- 7 Kent Ct
- 7 Kent Ct Unit 7-3