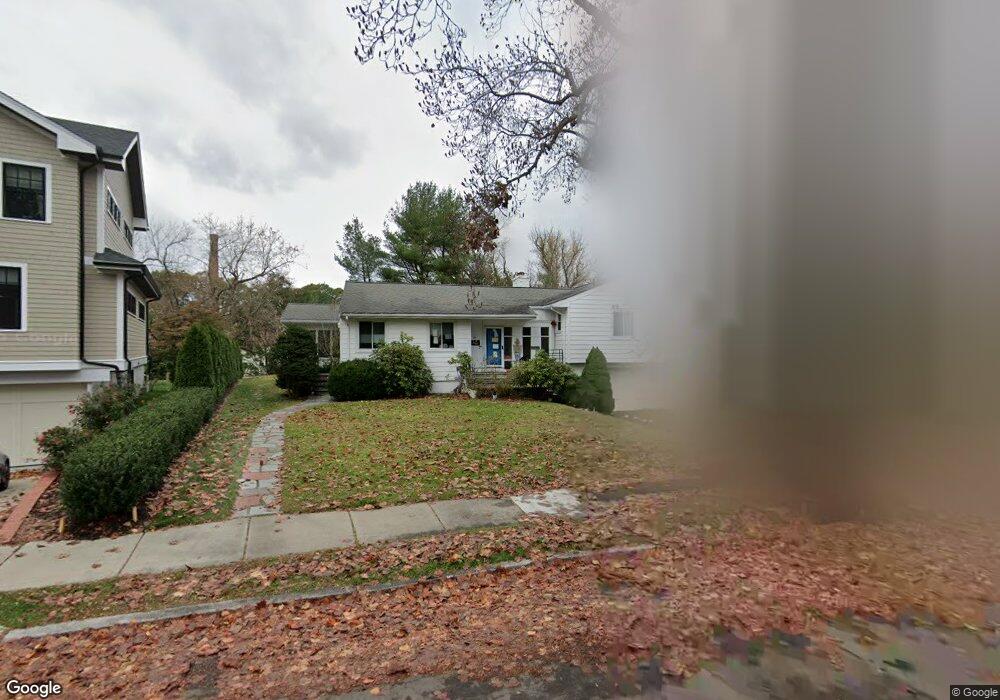
51 Cleveland Rd Unit 1 Chestnut Hill, MA 02467
Chestnut Hill NeighborhoodEstimated Value: $1,715,000 - $2,714,000
4
Beds
3
Baths
3,250
Sq Ft
$714/Sq Ft
Est. Value
About This Home
This home is located at 51 Cleveland Rd Unit 1, Chestnut Hill, MA 02467 and is currently estimated at $2,321,960, approximately $714 per square foot. 51 Cleveland Rd Unit 1 is a home located in Norfolk County with nearby schools including Heath Elementary School, Brimmer & May School, and The Chestnut Hill School.
Ownership History
Date
Name
Owned For
Owner Type
Purchase Details
Closed on
Sep 19, 2024
Sold by
Liu Chihwei and Zhao Liang
Bought by
Liu Ft and Slomiak
Current Estimated Value
Purchase Details
Closed on
Dec 12, 1996
Sold by
Solomont Ahron M and Solomont Sheera A
Bought by
Sanieoff Sieon
Home Financials for this Owner
Home Financials are based on the most recent Mortgage that was taken out on this home.
Original Mortgage
$459,000
Interest Rate
7.75%
Mortgage Type
Purchase Money Mortgage
Purchase Details
Closed on
Nov 6, 1989
Sold by
Greenbaum Priscilla
Bought by
Solomont Ahron M
Home Financials for this Owner
Home Financials are based on the most recent Mortgage that was taken out on this home.
Original Mortgage
$297,000
Interest Rate
9.9%
Mortgage Type
Purchase Money Mortgage
Create a Home Valuation Report for This Property
The Home Valuation Report is an in-depth analysis detailing your home's value as well as a comparison with similar homes in the area
Home Values in the Area
Average Home Value in this Area
Purchase History
| Date | Buyer | Sale Price | Title Company |
|---|---|---|---|
| Liu Ft | -- | None Available | |
| Liu Ft | -- | None Available | |
| Sanieoff Sieon | $510,000 | -- | |
| Sanieoff Sieon | $510,000 | -- | |
| Solomont Ahron M | $495,000 | -- |
Source: Public Records
Mortgage History
| Date | Status | Borrower | Loan Amount |
|---|---|---|---|
| Previous Owner | Solomont Ahron M | $420,000 | |
| Previous Owner | Sanieoff Sieon | $459,000 | |
| Previous Owner | Solomont Ahron M | $297,000 |
Source: Public Records
Tax History Compared to Growth
Tax History
| Year | Tax Paid | Tax Assessment Tax Assessment Total Assessment is a certain percentage of the fair market value that is determined by local assessors to be the total taxable value of land and additions on the property. | Land | Improvement |
|---|---|---|---|---|
| 2025 | $22,964 | $2,326,600 | $1,476,000 | $850,600 |
| 2024 | $21,890 | $2,240,500 | $1,419,200 | $821,300 |
| 2023 | $19,087 | $1,914,400 | $1,149,200 | $765,200 |
| 2022 | $18,578 | $1,823,200 | $1,094,400 | $728,800 |
| 2021 | $17,180 | $1,753,100 | $1,052,300 | $700,800 |
| 2020 | $15,575 | $1,648,100 | $956,700 | $691,400 |
| 2019 | $14,707 | $1,569,600 | $911,100 | $658,500 |
| 2018 | $14,405 | $1,522,700 | $930,800 | $591,900 |
| 2017 | $15,724 | $1,591,500 | $1,033,200 | $558,300 |
| 2016 | $13,989 | $1,342,500 | $820,700 | $521,800 |
| 2015 | $13,400 | $1,254,700 | $767,000 | $487,700 |
| 2014 | $13,160 | $1,155,400 | $697,300 | $458,100 |
Source: Public Records
Map
Nearby Homes
- 142 Crafts Rd
- 30 Ackers Ave
- 2400 Beacon St Unit 112
- 174 Middlesex Rd
- 540 Chestnut Hill Ave
- 9 Willard Rd
- 6 Sutherland Rd Unit 41
- 55 Reservoir Rd Unit 2
- 44 Orkney Rd Unit 3
- 88 Cutler Ln
- 41 Orkney Rd
- 1014 Boylston St
- 31 Orkney Rd Unit 54
- 76 Norfolk Rd
- 675 Chestnut Hill Ave
- 17 Strathmore Rd Unit 2
- 19-21 Orkney Rd
- 8 Strathmore Rd Unit G
- 1880 Beacon St Unit 6
- 130 Cabot St
- 51 Cleveland Rd
- 51 Cleveland Rd Unit 51
- 45 Cleveland Rd
- 57 Cleveland Rd
- 50 Cleveland Rd
- 65 Cleveland Rd
- 63 Cleveland Rd
- 39 Cleveland Rd
- 62 Cleveland Rd
- 524 Clinton Rd
- 230 Eliot St
- 520 Clinton Rd
- 510 Clinton Rd
- 40 Cleveland Rd
- 69 Cleveland Rd
- 208 Eliot St
- 506 Clinton Rd
- 238 Eliot St
- 70 Cleveland Rd
- 500 Clinton Rd