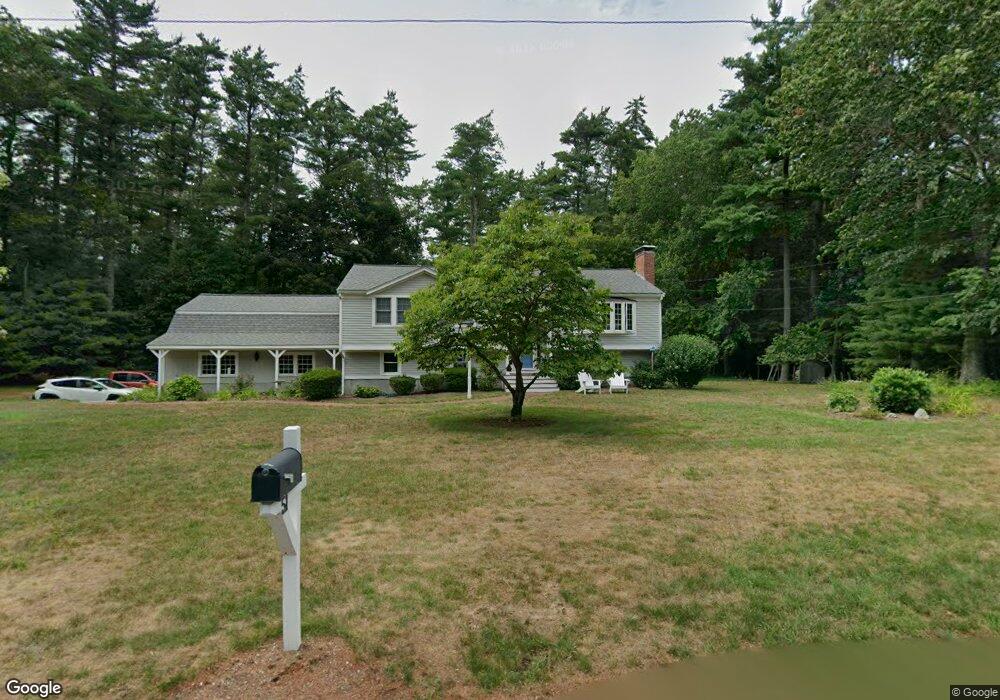
51 Cranberry Dr Duxbury, MA 02332
Estimated Value: $703,000 - $813,000
3
Beds
2
Baths
1,184
Sq Ft
$623/Sq Ft
Est. Value
About This Home
This home is located at 51 Cranberry Dr, Duxbury, MA 02332 and is currently estimated at $737,183, approximately $622 per square foot. 51 Cranberry Dr is a home located in Plymouth County with nearby schools including Chandler Elementary School, Alden School, and Duxbury Middle School.
Ownership History
Date
Name
Owned For
Owner Type
Purchase Details
Closed on
Jul 20, 1988
Sold by
Ross William G
Bought by
Bray Dennis P
Current Estimated Value
Home Financials for this Owner
Home Financials are based on the most recent Mortgage that was taken out on this home.
Original Mortgage
$100,000
Interest Rate
10.49%
Mortgage Type
Purchase Money Mortgage
Create a Home Valuation Report for This Property
The Home Valuation Report is an in-depth analysis detailing your home's value as well as a comparison with similar homes in the area
Home Values in the Area
Average Home Value in this Area
Purchase History
| Date | Buyer | Sale Price | Title Company |
|---|---|---|---|
| Bray Dennis P | $185,000 | -- |
Source: Public Records
Mortgage History
| Date | Status | Borrower | Loan Amount |
|---|---|---|---|
| Open | Bray Dennis P | $102,500 | |
| Closed | Bray Dennis P | $110,000 | |
| Closed | Bray Dennis P | $100,000 |
Source: Public Records
Tax History Compared to Growth
Tax History
| Year | Tax Paid | Tax Assessment Tax Assessment Total Assessment is a certain percentage of the fair market value that is determined by local assessors to be the total taxable value of land and additions on the property. | Land | Improvement |
|---|---|---|---|---|
| 2025 | $7,150 | $705,100 | $350,700 | $354,400 |
| 2024 | $6,337 | $629,900 | $350,700 | $279,200 |
| 2023 | $6,788 | $635,000 | $364,700 | $270,300 |
| 2022 | $6,715 | $523,000 | $300,600 | $222,400 |
| 2021 | $6,457 | $445,900 | $250,500 | $195,400 |
| 2020 | $5,931 | $404,600 | $252,500 | $152,100 |
| 2019 | $5,410 | $368,500 | $210,400 | $158,100 |
| 2018 | $5,335 | $351,900 | $195,600 | $156,300 |
| 2017 | $5,120 | $330,100 | $182,700 | $147,400 |
| 2016 | $5,133 | $330,100 | $182,700 | $147,400 |
| 2015 | $4,788 | $306,900 | $159,500 | $147,400 |
Source: Public Records
Map
Nearby Homes
- 202 Birch St
- 600 Summer St Unit 6
- 61 Chapel St
- 96 Lake Shore Dr
- 6 Carriage Ln Unit 6
- 346 Summer St
- 110 Keene St
- 249 High St
- 27 Chestnut Rd
- 345 Forest St
- 234 Forest St
- 65 Hitty Tom Rd
- 15 Autumn Ave
- 0 East St
- 64 Trout Farm Ln
- 0 Kingstown Way
- 42 Trout Farm Ln Unit 2
- 17 Trout Farm Ln
- 45 Summer St
- 18 King Phillips Path