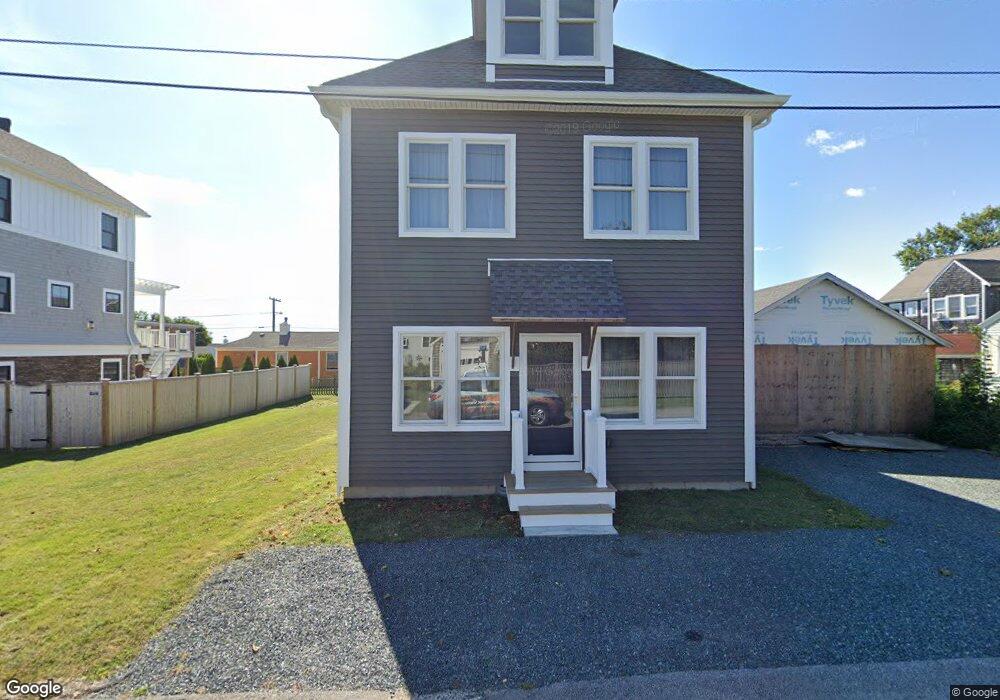
51 Crest St Middletown, RI 02842
Estimated Value: $1,138,116 - $1,548,000
3
Beds
2
Baths
1,920
Sq Ft
$739/Sq Ft
Est. Value
About This Home
This home is located at 51 Crest St, Middletown, RI 02842 and is currently estimated at $1,419,279, approximately $739 per square foot. 51 Crest St is a home located in Newport County with nearby schools including Middletown High School, St Michael's Country Day School, and St George's School.
Ownership History
Date
Name
Owned For
Owner Type
Purchase Details
Closed on
Apr 5, 2017
Sold by
Martin William N
Bought by
Martin William N and Blackwood Maureen A
Current Estimated Value
Home Financials for this Owner
Home Financials are based on the most recent Mortgage that was taken out on this home.
Original Mortgage
$560,000
Outstanding Balance
$464,304
Interest Rate
4.25%
Mortgage Type
Adjustable Rate Mortgage/ARM
Estimated Equity
$954,975
Purchase Details
Closed on
Feb 6, 2004
Sold by
F M Properties
Bought by
Martin William
Home Financials for this Owner
Home Financials are based on the most recent Mortgage that was taken out on this home.
Original Mortgage
$218,800
Interest Rate
5.8%
Mortgage Type
Purchase Money Mortgage
Create a Home Valuation Report for This Property
The Home Valuation Report is an in-depth analysis detailing your home's value as well as a comparison with similar homes in the area
Home Values in the Area
Average Home Value in this Area
Purchase History
| Date | Buyer | Sale Price | Title Company |
|---|---|---|---|
| Martin William | $262,500 | -- | |
| Martin William N | -- | -- |
Source: Public Records
Mortgage History
| Date | Status | Borrower | Loan Amount |
|---|---|---|---|
| Open | Martin William N | $560,000 | |
| Previous Owner | Martin William | $238,014 | |
| Previous Owner | Martin William | $260,000 | |
| Previous Owner | Martin William | $218,800 |
Source: Public Records
Tax History
| Year | Tax Paid | Tax Assessment Tax Assessment Total Assessment is a certain percentage of the fair market value that is determined by local assessors to be the total taxable value of land and additions on the property. | Land | Improvement |
|---|---|---|---|---|
| 2025 | $8,742 | $741,500 | $738,600 | $2,900 |
| 2024 | $8,349 | $741,500 | $738,600 | $2,900 |
| 2023 | $5,509 | $437,600 | $434,700 | $2,900 |
| 2022 | $5,260 | $437,600 | $434,700 | $2,900 |
| 2021 | $9,319 | $775,300 | $543,400 | $231,900 |
| 2020 | $7,608 | $552,900 | $363,500 | $189,400 |
| 2018 | $5,294 | $385,000 | $363,500 | $21,500 |
| 2016 | $5,483 | $355,600 | $259,000 | $96,600 |
| 2015 | $5,348 | $355,600 | $259,000 | $96,600 |
| 2014 | $5,454 | $339,400 | $247,700 | $91,700 |
| 2013 | $5,332 | $339,400 | $247,700 | $91,700 |
Source: Public Records
Map
Nearby Homes
- 140 Tuckerman Ave
- 0 Allston Ave
- 11 Odonnell Rd
- 4 James St
- 181 Center Ave
- 118 Wolcott Ave
- 265 Prospect Ave
- 129 Bliss Mine Rd
- 10 Oceanview Dr
- 78 Ellery Rd
- 55 John Clarke Rd Unit 8
- 55 John Clarke Rd Unit 3
- 131 Eustis Ave
- 141 Gray Craig Rd
- 14 Kay Blvd
- 30 Toppa Blvd
- 5 Dresser St
- 198 Gibbs Ave
- 1 Oakwood Terrace Unit 7
- 4 Red Cross Ave Unit 4
Your Personal Tour Guide
Ask me questions while you tour the home.