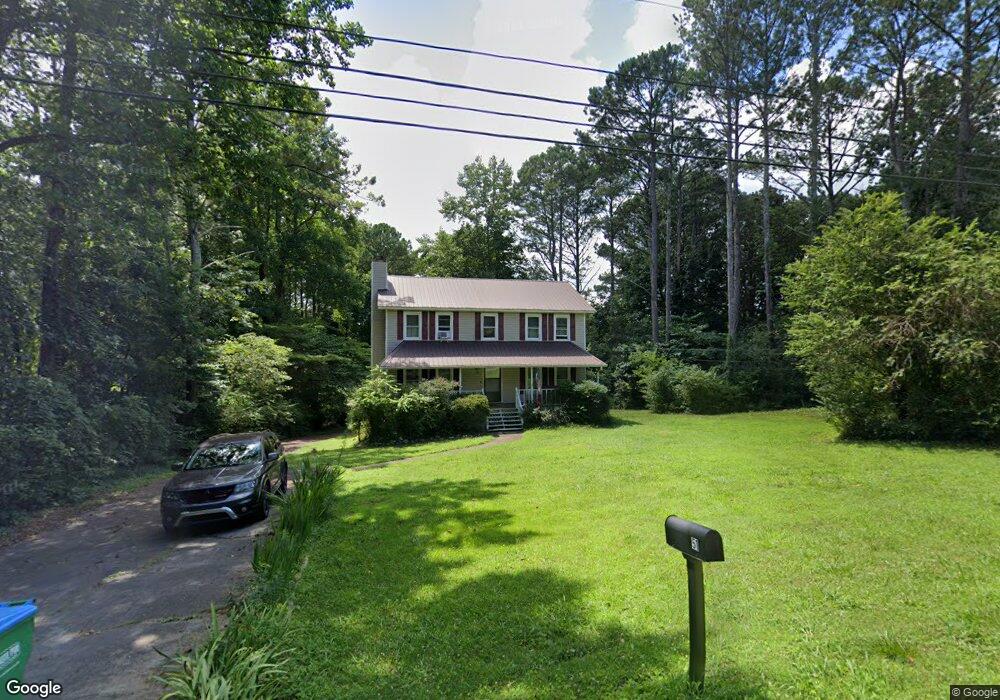
51 Deer Chase Dr Jasper, GA 30143
Estimated Value: $306,000 - $383,000
Studio
2
Baths
1,980
Sq Ft
$174/Sq Ft
Est. Value
About This Home
This home is located at 51 Deer Chase Dr, Jasper, GA 30143 and is currently estimated at $344,925, approximately $174 per square foot. 51 Deer Chase Dr is a home located in Pickens County with nearby schools including Harmony Elementary School, Pickens County Middle School, and Pickens County High School.
Ownership History
Date
Name
Owned For
Owner Type
Purchase Details
Closed on
Jan 12, 2021
Sold by
Williams David Robert
Bought by
Moriarty Jay
Current Estimated Value
Home Financials for this Owner
Home Financials are based on the most recent Mortgage that was taken out on this home.
Original Mortgage
$214,000
Outstanding Balance
$189,538
Interest Rate
2.67%
Mortgage Type
VA
Estimated Equity
$155,387
Purchase Details
Closed on
Jun 5, 2002
Sold by
Williams David Robert
Bought by
Williams David Robert
Purchase Details
Closed on
May 26, 2000
Sold by
Parker David L and Parker Arol
Bought by
Williams David Rober
Purchase Details
Closed on
Feb 26, 1996
Bought by
Parker David L and Parker Arol
Purchase Details
Closed on
Dec 21, 1994
Bought by
Parker David Lee and Carol Ann
Purchase Details
Closed on
Nov 13, 1987
Bought by
Stancil Carl and Stancil Jean
Create a Home Valuation Report for This Property
The Home Valuation Report is an in-depth analysis detailing your home's value as well as a comparison with similar homes in the area
Home Values in the Area
Average Home Value in this Area
Purchase History
| Date | Buyer | Sale Price | Title Company |
|---|---|---|---|
| Moriarty Jay | $214,000 | -- | |
| Williams David Robert | -- | -- | |
| Williams David Rober | $119,000 | -- | |
| Parker David L | -- | -- | |
| Parker David Lee | $85,000 | -- | |
| Stancil Carl | $78,000 | -- |
Source: Public Records
Mortgage History
| Date | Status | Borrower | Loan Amount |
|---|---|---|---|
| Open | Moriarty Jay | $214,000 |
Source: Public Records
Tax History
| Year | Tax Paid | Tax Assessment Tax Assessment Total Assessment is a certain percentage of the fair market value that is determined by local assessors to be the total taxable value of land and additions on the property. | Land | Improvement |
|---|---|---|---|---|
| 2025 | $2,137 | $118,006 | $12,000 | $106,006 |
| 2024 | $2,333 | $117,868 | $12,000 | $105,868 |
| 2023 | $1,732 | $85,173 | $12,000 | $73,173 |
| 2022 | $1,732 | $85,173 | $12,000 | $73,173 |
| 2021 | $1,856 | $85,173 | $12,000 | $73,173 |
| 2020 | $1,201 | $58,524 | $6,000 | $52,524 |
| 2019 | $1,229 | $58,276 | $6,000 | $52,276 |
| 2018 | $962 | $46,522 | $6,000 | $40,522 |
| 2017 | $978 | $46,522 | $6,000 | $40,522 |
| 2016 | $994 | $46,522 | $6,000 | $40,522 |
| 2015 | $971 | $46,522 | $6,000 | $40,522 |
| 2014 | $973 | $46,522 | $6,000 | $40,522 |
| 2013 | -- | $46,522 | $6,000 | $40,522 |
Source: Public Records
Map
Nearby Homes
- 3418 Refuge Rd
- 3691 Hwy 515
- 117 Cornett Ln S
- 3011 Refuge Rd
- 65 Grand Cir
- 304 Cornett Ln S
- 24 Teton Trail
- 405 Thrasher Ln
- 104 Cornett Ln S
- 269 Grand Cir
- 374 Mountain Blvd S Unit 23
- 10 Parker Ln
- 74 Refuge Valley Rd
- 789 Allred Mill Rd
- 99 Davis Dr
- 348 Danburg Ct
- 161 Ambrose Dr
- 262 Danburg Ct
- 259 Holley Heights
- 170 Carver Rd
- 19 Deer Chase Dr
- 99 Deer Chase Dr
- 1 Boling Fountain Rd
- 2 Deer Chase Dr
- LOT 1 Boling Fountain Rd
- 199 Deer Chase Dr
- 5183 Deer
- 81 Boling Fountain Rd
- 154 Boling Fountain Rd
- 3554 Refuge Rd
- 150 Deer Chase Dr
- 130 Deer Chase Dr
- 178 Deer Chase Dr
- 124 Deer Chase Dr
- 223 Deer Chase Dr
- 3484 Refuge Rd
- 200 Deer Chase Dr
- 125 Boling Fountain Rd
- 3480 Refuge Rd
- 30 Stephens View Rd
Your Personal Tour Guide
Ask me questions while you tour the home.