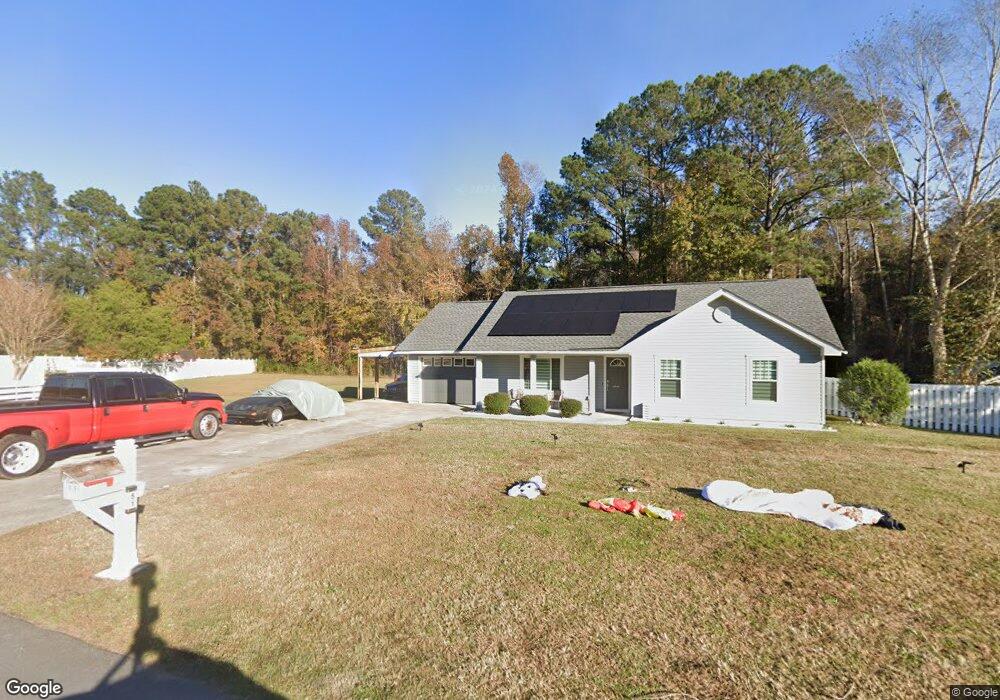
51 Del A Rae Cir Guyton, GA 31312
Estimated Value: $261,000 - $269,000
3
Beds
2
Baths
1,146
Sq Ft
$232/Sq Ft
Est. Value
About This Home
This home is located at 51 Del A Rae Cir, Guyton, GA 31312 and is currently estimated at $265,974, approximately $232 per square foot. 51 Del A Rae Cir is a home located in Effingham County with nearby schools including Guyton Elementary School, Effingham County Middle School, and Effingham County High School.
Ownership History
Date
Name
Owned For
Owner Type
Purchase Details
Closed on
Sep 8, 2021
Sold by
Rollins Leah Tuten
Bought by
Sala Santana Joseph
Current Estimated Value
Home Financials for this Owner
Home Financials are based on the most recent Mortgage that was taken out on this home.
Original Mortgage
$161,616
Outstanding Balance
$147,059
Interest Rate
2.8%
Mortgage Type
New Conventional
Estimated Equity
$118,915
Purchase Details
Closed on
Aug 7, 2020
Sold by
Rollins Derek L
Bought by
Rollins Leah Tuten
Purchase Details
Closed on
Aug 15, 2005
Sold by
Rollins Derek L
Bought by
Rollins Derek L and Rollins Leah T
Create a Home Valuation Report for This Property
The Home Valuation Report is an in-depth analysis detailing your home's value as well as a comparison with similar homes in the area
Home Values in the Area
Average Home Value in this Area
Purchase History
| Date | Buyer | Sale Price | Title Company |
|---|---|---|---|
| Sala Santana Joseph | $160,000 | -- | |
| Rollins Leah Tuten | -- | -- | |
| Rollins Derek L | -- | -- |
Source: Public Records
Mortgage History
| Date | Status | Borrower | Loan Amount |
|---|---|---|---|
| Open | Sala Santana Joseph | $161,616 |
Source: Public Records
Tax History Compared to Growth
Tax History
| Year | Tax Paid | Tax Assessment Tax Assessment Total Assessment is a certain percentage of the fair market value that is determined by local assessors to be the total taxable value of land and additions on the property. | Land | Improvement |
|---|---|---|---|---|
| 2025 | $2,009 | $100,691 | $22,800 | $77,891 |
| 2024 | $2,009 | $89,638 | $22,800 | $66,838 |
| 2023 | $1,191 | $68,204 | $17,600 | $50,604 |
| 2022 | $1,854 | $57,609 | $14,800 | $42,809 |
| 2021 | $1,685 | $50,750 | $14,000 | $36,750 |
| 2020 | $1,596 | $48,059 | $12,000 | $36,059 |
| 2019 | $1,555 | $46,059 | $10,000 | $36,059 |
| 2018 | $1,431 | $43,494 | $10,000 | $33,494 |
| 2017 | $1,337 | $40,915 | $10,000 | $30,915 |
| 2016 | $1,253 | $41,169 | $10,000 | $31,169 |
| 2015 | -- | $39,867 | $10,000 | $29,867 |
| 2014 | -- | $33,867 | $4,000 | $29,867 |
| 2013 | -- | $27,433 | $4,000 | $23,433 |
Source: Public Records
Map
Nearby Homes
- 106 Sumter St
- 106 Serenoa Dr
- 105 Serenoa Dr
- 115 Juniper Dr
- 108 Serenoa Dr
- 101 Juniper Dr
- 104 Serenoa Dr
- 969 Ga Highway 17 N
- 0 Del - A - Rae Cir Unit 10573783
- 0 Simmons St
- 17 Summer Place Dr
- 2330 Georgia 17
- 5 Honeysuckle Ct
- 0 Ralph Rahn Rd Unit 329204
- 142 Buckeye Rd
- Tract 1 Williams St
- 105 Maple Cir
- 338 Gracen Rd
- 602 Magnolia St
- 515 Samuel Smalls Sr Ave
- 53 Del A Rae Cir
- 54 Del A Rae Cir
- 55 Del A Rae Cir
- 56 Del A Rae Cir
- 49 Del A Rae Cir
- 10 Jasmine Dr
- 58 Del A Rae Cir
- 57 Del A Rae Cir
- 8 Jasmine Dr
- 47 Del A Rae Cir
- 59 Del A Rae Cir
- 6 Jasmine Dr
- 945 Georgia 17
- 45 Del A Rae Cir
- 13 Jasmine Dr
- 13 Jasmine Dr Unit 58
- 11 Jasmine Dr
- 11 Jasmine Dr Unit 59
- 61 Del A Rae Cir
- 9 Jasmine Dr