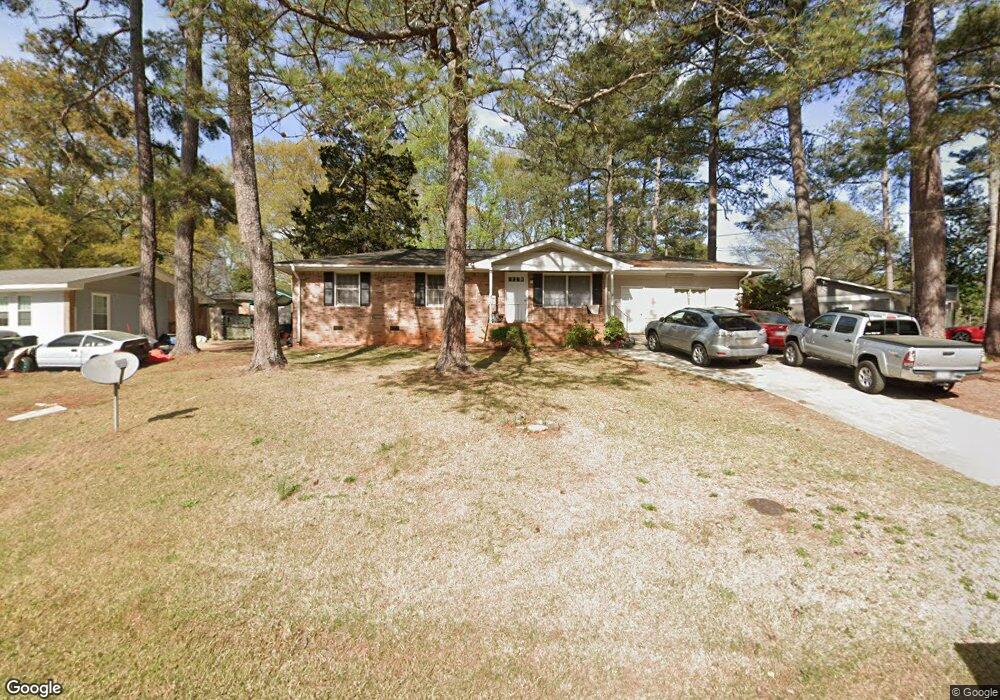
51 Dewey Ln SE Marietta, GA 30060
Southwestern Marietta NeighborhoodEstimated Value: $266,000 - $401,000
3
Beds
2
Baths
1,125
Sq Ft
$295/Sq Ft
Est. Value
About This Home
This home is located at 51 Dewey Ln SE, Marietta, GA 30060 and is currently estimated at $331,898, approximately $295 per square foot. 51 Dewey Ln SE is a home located in Cobb County with nearby schools including LaBelle Elementary School, Griffin Middle School, and Campbell High School.
Ownership History
Date
Name
Owned For
Owner Type
Purchase Details
Closed on
Oct 22, 2010
Sold by
Hud & Housing Of Urban Dev
Bought by
Vo Tham T and Dong My
Current Estimated Value
Purchase Details
Closed on
Feb 2, 2010
Sold by
Bac Hm Lns Svcng Lp
Bought by
Hud-Housing Of Urban Dev
Purchase Details
Closed on
Dec 16, 1999
Sold by
Drake Jonathan W and Drake Julia D
Bought by
Montano Leonel and Montano Lorena
Home Financials for this Owner
Home Financials are based on the most recent Mortgage that was taken out on this home.
Original Mortgage
$97,150
Interest Rate
7.67%
Mortgage Type
FHA
Purchase Details
Closed on
Aug 29, 1997
Sold by
Stell Scott and Stell Doug
Bought by
Drake Jonathan W and Drake Julia D
Home Financials for this Owner
Home Financials are based on the most recent Mortgage that was taken out on this home.
Original Mortgage
$65,491
Interest Rate
7.46%
Mortgage Type
FHA
Create a Home Valuation Report for This Property
The Home Valuation Report is an in-depth analysis detailing your home's value as well as a comparison with similar homes in the area
Home Values in the Area
Average Home Value in this Area
Purchase History
| Date | Buyer | Sale Price | Title Company |
|---|---|---|---|
| Vo Tham T | $39,209 | -- | |
| Hud-Housing Of Urban Dev | -- | -- | |
| Svng Bac Hm Lns | $148,399 | -- | |
| Montano Leonel | $98,000 | -- | |
| Drake Jonathan W | $65,000 | -- |
Source: Public Records
Mortgage History
| Date | Status | Borrower | Loan Amount |
|---|---|---|---|
| Previous Owner | Montano Leonel | $97,150 | |
| Previous Owner | Drake Jonathan W | $65,491 |
Source: Public Records
Tax History Compared to Growth
Tax History
| Year | Tax Paid | Tax Assessment Tax Assessment Total Assessment is a certain percentage of the fair market value that is determined by local assessors to be the total taxable value of land and additions on the property. | Land | Improvement |
|---|---|---|---|---|
| 2025 | $4,372 | $145,104 | $32,000 | $113,104 |
| 2024 | $4,580 | $151,904 | $24,000 | $127,904 |
| 2023 | $2,573 | $85,340 | $16,000 | $69,340 |
| 2022 | $2,590 | $85,340 | $16,000 | $69,340 |
| 2021 | $2,590 | $85,340 | $16,000 | $69,340 |
| 2020 | $1,701 | $56,036 | $16,000 | $40,036 |
| 2019 | $2,050 | $67,552 | $14,000 | $53,552 |
| 2018 | $1,544 | $50,884 | $14,000 | $36,884 |
| 2017 | $1,278 | $44,464 | $10,000 | $34,464 |
| 2016 | $1,140 | $39,668 | $8,000 | $31,668 |
| 2015 | $737 | $25,000 | $6,000 | $19,000 |
| 2014 | $743 | $25,000 | $0 | $0 |
Source: Public Records
Map
Nearby Homes
- 2379 Olive Springs Rd SE
- 85 Smyrna Powder Springs Rd SE
- 33 Smyrna Powder Springs Rd SE
- 2675 Sandtown Rd SW
- 51 Overbrook Dr SE Unit 3
- 285 Windy Hill Rd SE
- 1007 Chateau Ln SE
- 2245 Panstone Dr SW
- 2041 White Cypress Ct
- 244 Timber Creek Ln SW
- 355 Benson Manor Cir SE
- 264 Rockin Hill Dr SW
- 166 Zelma St SW
- 174 Timber Creek Ln SW Unit 176
- 2354 Holly Hill Ct SW
- 169 Long Dr SW
- 235 Still Pine Bend
- 119 Still Pine Bend
- 187 Timber Creek Ln SW
- 59 Dewey Ln SE
- 43 Dewey Ln SE
- 0 Dewey Ln Unit 8506852
- 0 Dewey Ln Unit 8070407
- 0 Dewey Ln
- 48 Dewey Ln SE
- 42 Dewey Ln SE
- 67 Dewey Ln SE
- 35 Dewey Ln SE
- 54 Dewey Ln SE
- 58 Barrett Cir SE
- 50 Barrett Cir SE
- 60 Dewey Ln SE
- 64 Barrett Cir SE
- 75 Dewey Ln SE
- 36 Dewey Ln SE
- 42 Barrett Cir SE
- 76 Dewey Ln SE
- 72 Barrett Cir SE
- 36 Barrett Cir SE