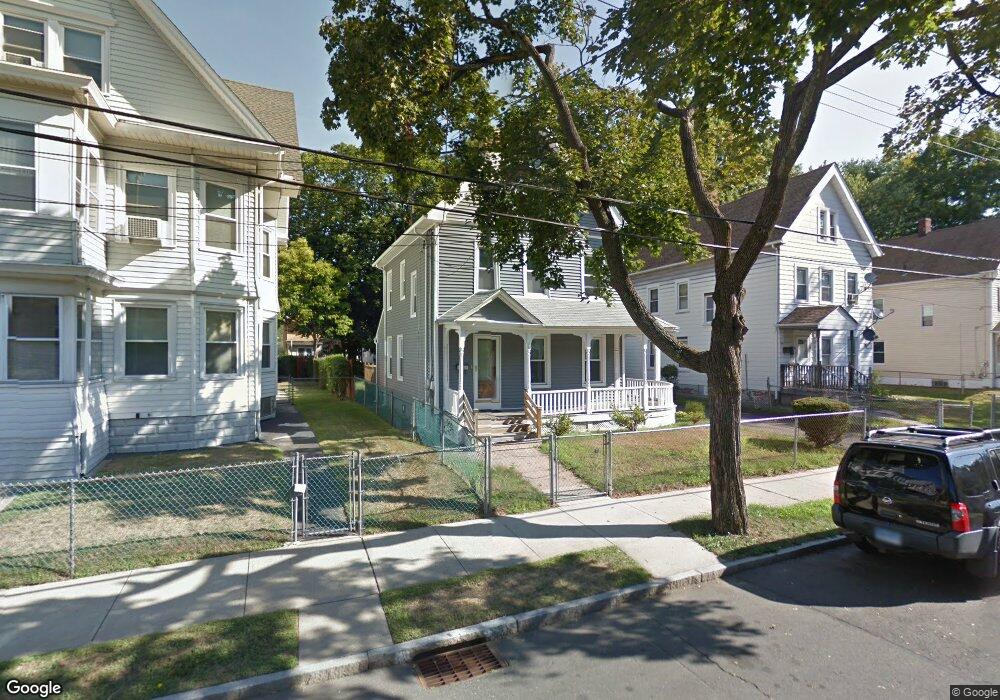
51 Dorman St New Haven, CT 06511
Newhallville NeighborhoodEstimated Value: $319,000 - $326,000
3
Beds
2
Baths
1,609
Sq Ft
$201/Sq Ft
Est. Value
About This Home
This home is located at 51 Dorman St, New Haven, CT 06511 and is currently estimated at $323,672, approximately $201 per square foot. 51 Dorman St is a home located in New Haven County with nearby schools including King/Robinson Magnet School and Highville Charter School.
Ownership History
Date
Name
Owned For
Owner Type
Purchase Details
Closed on
Oct 30, 2007
Sold by
Lawrence Christopher
Bought by
Conyers Sarynthia
Current Estimated Value
Home Financials for this Owner
Home Financials are based on the most recent Mortgage that was taken out on this home.
Original Mortgage
$176,500
Outstanding Balance
$111,731
Interest Rate
6.39%
Estimated Equity
$211,941
Create a Home Valuation Report for This Property
The Home Valuation Report is an in-depth analysis detailing your home's value as well as a comparison with similar homes in the area
Home Values in the Area
Average Home Value in this Area
Purchase History
| Date | Buyer | Sale Price | Title Company |
|---|---|---|---|
| Conyers Sarynthia | $182,000 | -- |
Source: Public Records
Mortgage History
| Date | Status | Borrower | Loan Amount |
|---|---|---|---|
| Open | Conyers Sarynthia | $176,500 | |
| Previous Owner | Conyers Sarynthia | $14,000 | |
| Previous Owner | Conyers Sarynthia | $4,800 | |
| Previous Owner | Conyers Sarynthia | $53,000 |
Source: Public Records
Tax History Compared to Growth
Tax History
| Year | Tax Paid | Tax Assessment Tax Assessment Total Assessment is a certain percentage of the fair market value that is determined by local assessors to be the total taxable value of land and additions on the property. | Land | Improvement |
|---|---|---|---|---|
| 2025 | $5,930 | $150,500 | $33,460 | $117,040 |
| 2024 | $5,794 | $150,500 | $33,460 | $117,040 |
| 2023 | $5,599 | $150,500 | $33,460 | $117,040 |
| 2022 | $5,982 | $150,500 | $33,460 | $117,040 |
| 2021 | $4,227 | $96,320 | $26,810 | $69,510 |
| 2020 | $4,227 | $96,320 | $26,810 | $69,510 |
| 2019 | $4,089 | $95,130 | $26,810 | $68,320 |
| 2018 | $4,089 | $95,130 | $26,810 | $68,320 |
| 2017 | $3,680 | $95,130 | $26,810 | $68,320 |
| 2016 | $3,220 | $77,490 | $11,900 | $65,590 |
| 2015 | $3,220 | $77,490 | $11,900 | $65,590 |
| 2014 | $3,220 | $77,490 | $11,900 | $65,590 |
Source: Public Records
Map
Nearby Homes