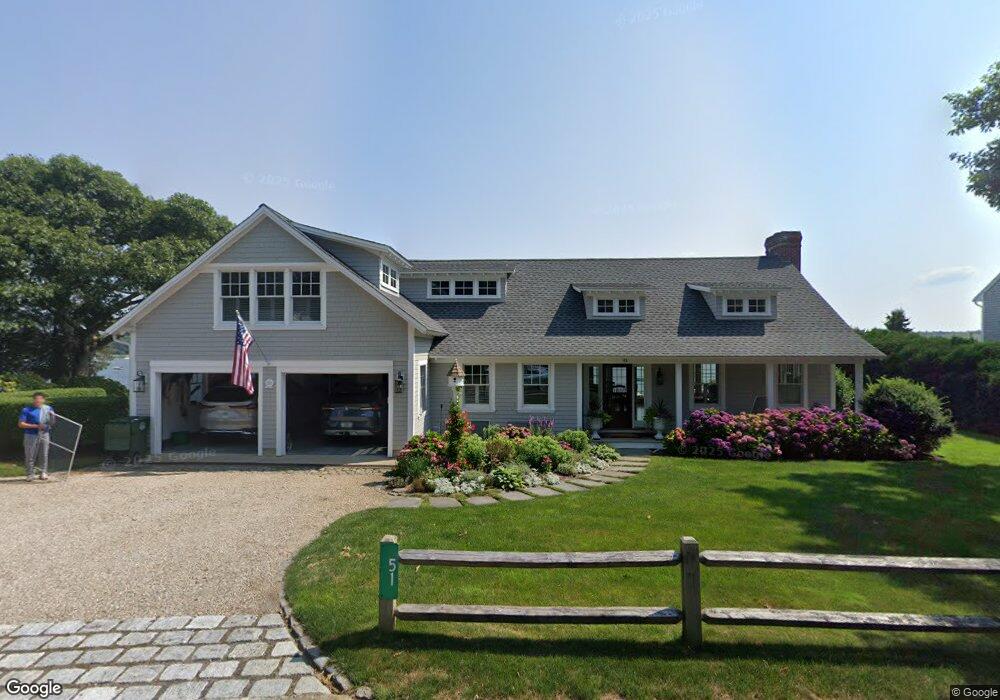
51 East Ave Marion, MA 02738
Estimated Value: $1,982,000 - $2,204,282
3
Beds
5
Baths
2,494
Sq Ft
$851/Sq Ft
Est. Value
About This Home
This home is located at 51 East Ave, Marion, MA 02738 and is currently estimated at $2,121,821, approximately $850 per square foot. 51 East Ave is a home located in Plymouth County with nearby schools including Old Rochester Regional High School.
Ownership History
Date
Name
Owned For
Owner Type
Purchase Details
Closed on
Sep 28, 2018
Sold by
Whittemore John A and Whittemore Carole F
Bought by
Whittemore John A and Whittemore Carole P
Current Estimated Value
Purchase Details
Closed on
Jan 30, 1998
Sold by
Walsh Donald J and Walsh Barry A
Bought by
Whittemore John A
Create a Home Valuation Report for This Property
The Home Valuation Report is an in-depth analysis detailing your home's value as well as a comparison with similar homes in the area
Home Values in the Area
Average Home Value in this Area
Purchase History
| Date | Buyer | Sale Price | Title Company |
|---|---|---|---|
| Whittemore John A | -- | -- | |
| Whittemore John A | $360,000 | -- |
Source: Public Records
Tax History Compared to Growth
Tax History
| Year | Tax Paid | Tax Assessment Tax Assessment Total Assessment is a certain percentage of the fair market value that is determined by local assessors to be the total taxable value of land and additions on the property. | Land | Improvement |
|---|---|---|---|---|
| 2025 | $18,649 | $2,000,971 | $1,392,571 | $608,400 |
| 2024 | $16,946 | $1,829,976 | $1,271,476 | $558,500 |
| 2023 | $15,417 | $1,633,200 | $1,093,200 | $540,000 |
| 2022 | $17,041 | $1,570,561 | $1,216,161 | $354,400 |
| 2021 | $17,359 | $1,533,504 | $1,164,404 | $369,100 |
| 2020 | $15,196 | $1,298,800 | $929,700 | $369,100 |
| 2019 | $0 | $1,200,400 | $846,400 | $354,000 |
| 2018 | $0 | $1,255,200 | $906,000 | $349,200 |
| 2017 | $0 | $1,255,200 | $906,000 | $349,200 |
| 2016 | $14,257 | $1,260,600 | $906,000 | $354,600 |
| 2015 | $14,576 | $1,312,000 | $972,900 | $339,100 |
Source: Public Records
Map
Nearby Homes