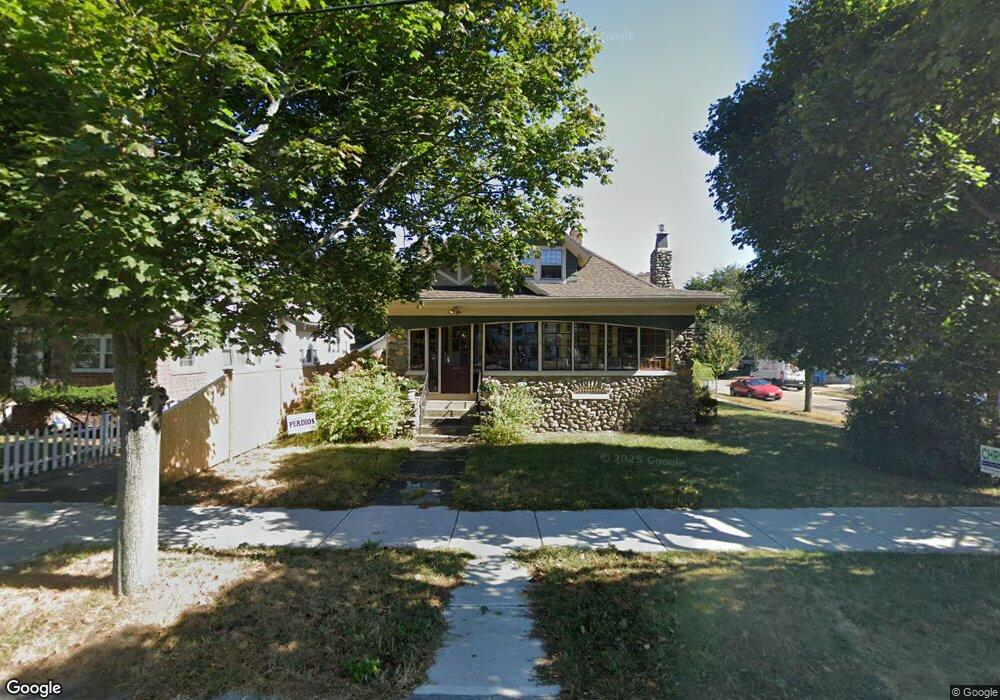
51 Elm Ave Quincy, MA 02170
Wollaston NeighborhoodEstimated Value: $798,000 - $913,000
4
Beds
1
Bath
1,938
Sq Ft
$436/Sq Ft
Est. Value
About This Home
This home is located at 51 Elm Ave, Quincy, MA 02170 and is currently estimated at $845,229, approximately $436 per square foot. 51 Elm Ave is a home located in Norfolk County with nearby schools including Beechwood Knoll Elementary School, Central Middle School, and North Quincy High School.
Ownership History
Date
Name
Owned For
Owner Type
Purchase Details
Closed on
Aug 28, 2025
Sold by
Hurley Michael M and Hurley Katherine Z
Bought by
Hurley Int and Hurley H
Current Estimated Value
Purchase Details
Closed on
Jul 2, 2001
Sold by
Ulchak Robert M and Ulchak Diane M
Bought by
Hurley Michael M
Home Financials for this Owner
Home Financials are based on the most recent Mortgage that was taken out on this home.
Original Mortgage
$98,250
Interest Rate
7.14%
Mortgage Type
Purchase Money Mortgage
Create a Home Valuation Report for This Property
The Home Valuation Report is an in-depth analysis detailing your home's value as well as a comparison with similar homes in the area
Home Values in the Area
Average Home Value in this Area
Purchase History
| Date | Buyer | Sale Price | Title Company |
|---|---|---|---|
| Hurley Int | -- | -- | |
| Hurley Michael M | $355,000 | -- |
Source: Public Records
Mortgage History
| Date | Status | Borrower | Loan Amount |
|---|---|---|---|
| Previous Owner | Hurley Michael M | $98,250 |
Source: Public Records
Tax History Compared to Growth
Tax History
| Year | Tax Paid | Tax Assessment Tax Assessment Total Assessment is a certain percentage of the fair market value that is determined by local assessors to be the total taxable value of land and additions on the property. | Land | Improvement |
|---|---|---|---|---|
| 2025 | $8,385 | $727,200 | $368,200 | $359,000 |
| 2024 | $8,059 | $715,100 | $368,200 | $346,900 |
| 2023 | $7,801 | $700,900 | $350,600 | $350,300 |
| 2022 | $7,561 | $631,100 | $280,500 | $350,600 |
| 2021 | $7,373 | $607,300 | $280,500 | $326,800 |
| 2020 | $7,350 | $591,300 | $280,500 | $310,800 |
| 2019 | $6,916 | $551,100 | $262,200 | $288,900 |
| 2018 | $6,766 | $507,200 | $238,400 | $268,800 |
| 2017 | $6,739 | $475,600 | $238,400 | $237,200 |
| 2016 | $6,291 | $438,100 | $216,700 | $221,400 |
| 2015 | $5,779 | $395,800 | $197,000 | $198,800 |
| 2014 | $5,434 | $365,700 | $187,600 | $178,100 |
Source: Public Records
Map
Nearby Homes
- 140 Phillips St
- 11 Earle St
- 163 Clay St Unit C
- 22 Newton Ave
- 100 Thornton St
- 111 Warren Ave Unit 1F
- 100 Grandview Ave Unit 11A
- 250 Fayette St
- 143 Arlington St
- 45 Oval Rd Unit 6
- 20 Putnam St
- 72 Oakland Ave
- 74 Butler Rd
- 1025 Hancock St Unit 2K
- 17 Holmes St Unit 2
- 17 Holmes St Unit 4
- 10 Presidents Ln Unit 10
- 200 Adams St
- 169 Pine St
- 77 Adams St Unit 610