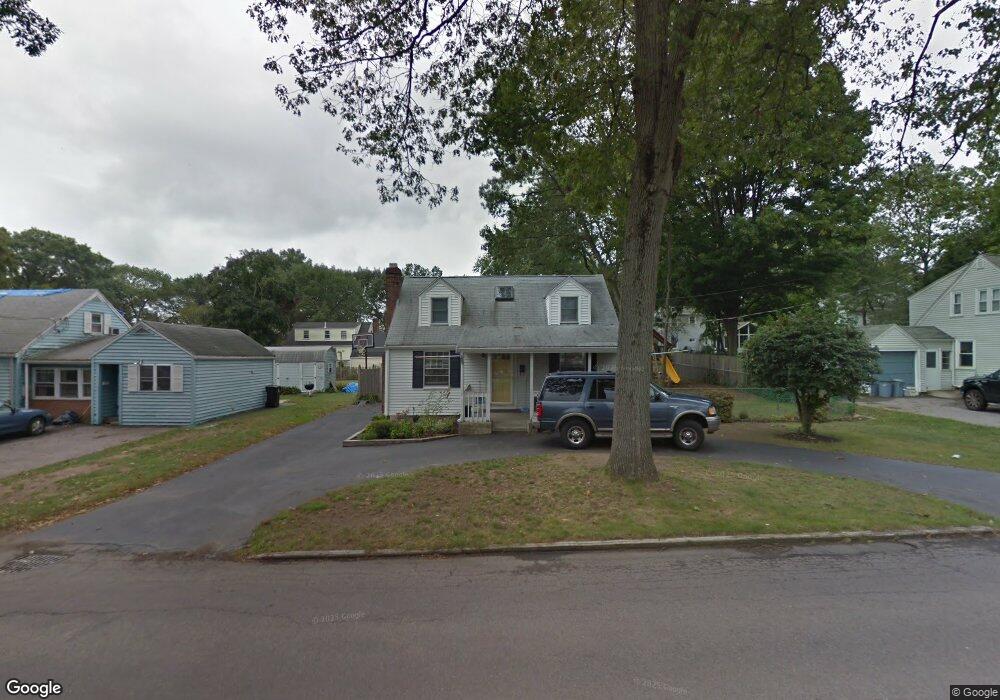
51 Fenwick St Framingham, MA 01701
Nobscot NeighborhoodEstimated Value: $469,000 - $640,000
3
Beds
2
Baths
1,566
Sq Ft
$357/Sq Ft
Est. Value
About This Home
This home is located at 51 Fenwick St, Framingham, MA 01701 and is currently estimated at $558,739, approximately $356 per square foot. 51 Fenwick St is a home located in Middlesex County with nearby schools including Framingham High School, MetroWest Jewish Day School, and Saint Bridget School.
Ownership History
Date
Name
Owned For
Owner Type
Purchase Details
Closed on
Sep 27, 1999
Sold by
Mancini Stephen M and Mancini Linda M
Bought by
Camerato Joseph J and Camerato Cathleen L
Current Estimated Value
Home Financials for this Owner
Home Financials are based on the most recent Mortgage that was taken out on this home.
Original Mortgage
$151,905
Interest Rate
8.1%
Mortgage Type
Purchase Money Mortgage
Create a Home Valuation Report for This Property
The Home Valuation Report is an in-depth analysis detailing your home's value as well as a comparison with similar homes in the area
Home Values in the Area
Average Home Value in this Area
Purchase History
| Date | Buyer | Sale Price | Title Company |
|---|---|---|---|
| Camerato Joseph J | $159,900 | -- |
Source: Public Records
Mortgage History
| Date | Status | Borrower | Loan Amount |
|---|---|---|---|
| Open | Camerato Joseph J | $250,100 | |
| Closed | Camerato Joseph J | $163,000 | |
| Closed | Camerato Joseph J | $151,905 | |
| Previous Owner | Camerato Joseph J | $100,000 |
Source: Public Records
Tax History
| Year | Tax Paid | Tax Assessment Tax Assessment Total Assessment is a certain percentage of the fair market value that is determined by local assessors to be the total taxable value of land and additions on the property. | Land | Improvement |
|---|---|---|---|---|
| 2025 | $6,242 | $522,800 | $259,300 | $263,500 |
| 2024 | $6,194 | $497,100 | $231,500 | $265,600 |
| 2023 | $5,876 | $448,900 | $206,600 | $242,300 |
| 2022 | $5,565 | $405,000 | $187,500 | $217,500 |
| 2021 | $5,397 | $384,100 | $180,200 | $203,900 |
| 2020 | $5,354 | $357,400 | $163,800 | $193,600 |
| 2019 | $5,215 | $339,100 | $163,800 | $175,300 |
| 2018 | $5,123 | $313,900 | $157,600 | $156,300 |
| 2017 | $4,996 | $299,000 | $153,100 | $145,900 |
| 2016 | $4,793 | $275,800 | $153,100 | $122,700 |
| 2015 | $4,708 | $264,200 | $152,800 | $111,400 |
Source: Public Records
Map
Nearby Homes
Your Personal Tour Guide
Ask me questions while you tour the home.