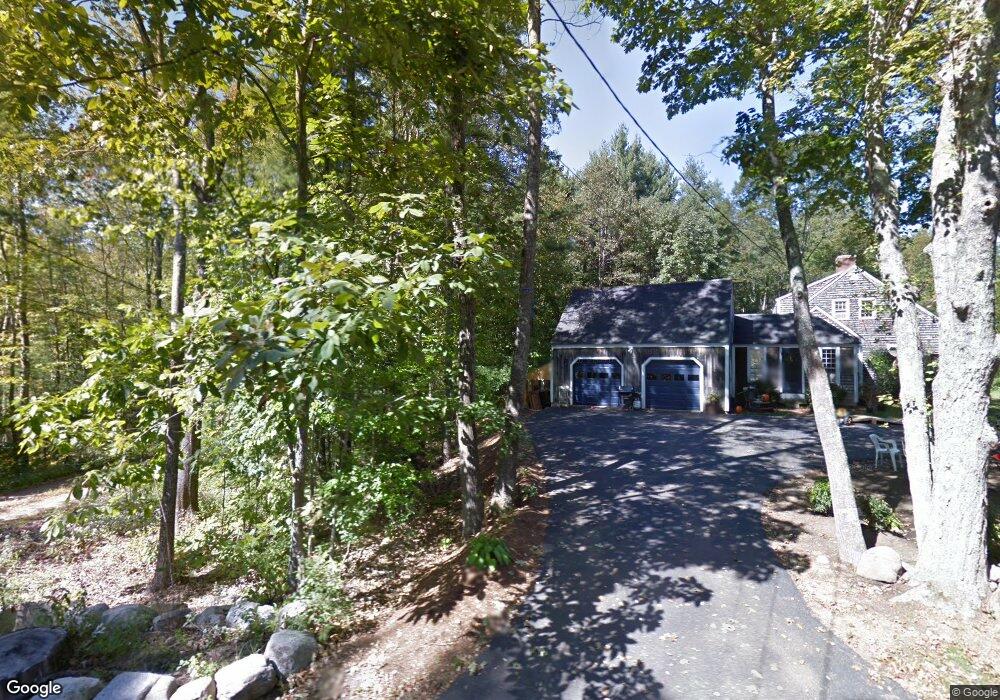
51 Frost Hill Rd Eliot, ME 03903
East Eliot NeighborhoodEstimated Value: $730,000 - $801,000
3
Beds
2
Baths
1,782
Sq Ft
$428/Sq Ft
Est. Value
About This Home
This home is located at 51 Frost Hill Rd, Eliot, ME 03903 and is currently estimated at $763,000, approximately $428 per square foot. 51 Frost Hill Rd is a home located in York County with nearby schools including Marshwood High School and Seacoast Waldorf School.
Ownership History
Date
Name
Owned For
Owner Type
Purchase Details
Closed on
Sep 30, 2022
Sold by
Christoforo Richard J
Bought by
Kelley David H and Kelley Elizabeth A
Current Estimated Value
Home Financials for this Owner
Home Financials are based on the most recent Mortgage that was taken out on this home.
Original Mortgage
$125,000
Outstanding Balance
$119,136
Interest Rate
5.13%
Mortgage Type
Purchase Money Mortgage
Estimated Equity
$643,864
Purchase Details
Closed on
Jan 15, 2020
Sold by
Finstad Brian and Halberg Seana
Bought by
Christoforo Richard J
Home Financials for this Owner
Home Financials are based on the most recent Mortgage that was taken out on this home.
Original Mortgage
$314,250
Interest Rate
3.6%
Mortgage Type
New Conventional
Purchase Details
Closed on
Mar 5, 2007
Sold by
Betts Ann M
Bought by
Hallberg Seanna and Finstad Brian
Home Financials for this Owner
Home Financials are based on the most recent Mortgage that was taken out on this home.
Original Mortgage
$295,200
Interest Rate
6.27%
Mortgage Type
Purchase Money Mortgage
Create a Home Valuation Report for This Property
The Home Valuation Report is an in-depth analysis detailing your home's value as well as a comparison with similar homes in the area
Home Values in the Area
Average Home Value in this Area
Purchase History
| Date | Buyer | Sale Price | Title Company |
|---|---|---|---|
| Kelley David H | $580,000 | None Available | |
| Christoforo Richard J | -- | None Available | |
| Christoforo Richard J | -- | None Available | |
| Hallberg Seanna | -- | -- |
Source: Public Records
Mortgage History
| Date | Status | Borrower | Loan Amount |
|---|---|---|---|
| Open | Kelley David H | $125,000 | |
| Previous Owner | Christoforo Richard J | $314,250 | |
| Previous Owner | Hallberg Seanna | $295,200 |
Source: Public Records
Tax History Compared to Growth
Tax History
| Year | Tax Paid | Tax Assessment Tax Assessment Total Assessment is a certain percentage of the fair market value that is determined by local assessors to be the total taxable value of land and additions on the property. | Land | Improvement |
|---|---|---|---|---|
| 2024 | $7,437 | $627,600 | $174,200 | $453,400 |
| 2023 | $6,936 | $566,200 | $165,600 | $400,600 |
| 2022 | $6,626 | $547,600 | $165,600 | $382,000 |
| 2021 | $5,377 | $398,300 | $108,000 | $290,300 |
| 2020 | $5,490 | $373,500 | $102,800 | $270,700 |
| 2019 | $4,628 | $314,800 | $102,800 | $212,000 |
| 2018 | $4,628 | $314,800 | $102,800 | $212,000 |
| 2017 | $1,135 | $314,800 | $102,800 | $212,000 |
| 2016 | $4,423 | $314,800 | $102,800 | $212,000 |
| 2015 | $4,407 | $314,800 | $102,800 | $212,000 |
| 2014 | $4,344 | $314,800 | $102,800 | $212,000 |
| 2013 | $4,146 | $314,800 | $102,800 | $212,000 |
Source: Public Records
Map
Nearby Homes
- 287 Goodwin Rd
- 0 Goodwin Rd Unit 1626810
- 46 Littlebrook Ln
- 373 Brixham Rd
- 3 Shaws Farm Ln Unit 1
- Lot 4 Stonecrop Farm Ln
- 68 Brixham Rd
- Lot 1 Brixham (Stonecrop Farm Lot 1) Rd
- 76 Punkintown Rd
- 10 Broadfields Rd
- 4 Bhoireann Ln
- 3 Bhoireann Ln
- 49 Betty Welch Rd
- TBD Cedar Rd
- Lot 1 Cedar Tbd
- Lot 2 Cedar Tbd
- 16 Imperial Dr
- 35 Marshwood Dr
- 19 Heritage Dr
- 34 Imperial Dr
- 61 Frost Hill Rd
- 55 Frost Hill Rd
- 26 Frost Hill Rd
- 71 Frost Hill Rd
- 58 Frost Hill Rd
- 65 Frost Hill Rd
- 64 Frost Hill Rd
- 12 Steelers Way
- 10 Great Hill Way
- 45 Frost Hill Rd
- 3 Steelers Way
- 14 Great Hill Way
- 77 Frost Hill Rd
- 12 Great Hill Way
- 6 Steelers Way
- 24 Great Hill Way
- TBD Thompson Ln
- 32 Great Hill Way
- 15 Samuel Leighton Way
- 23 Thompson Ln