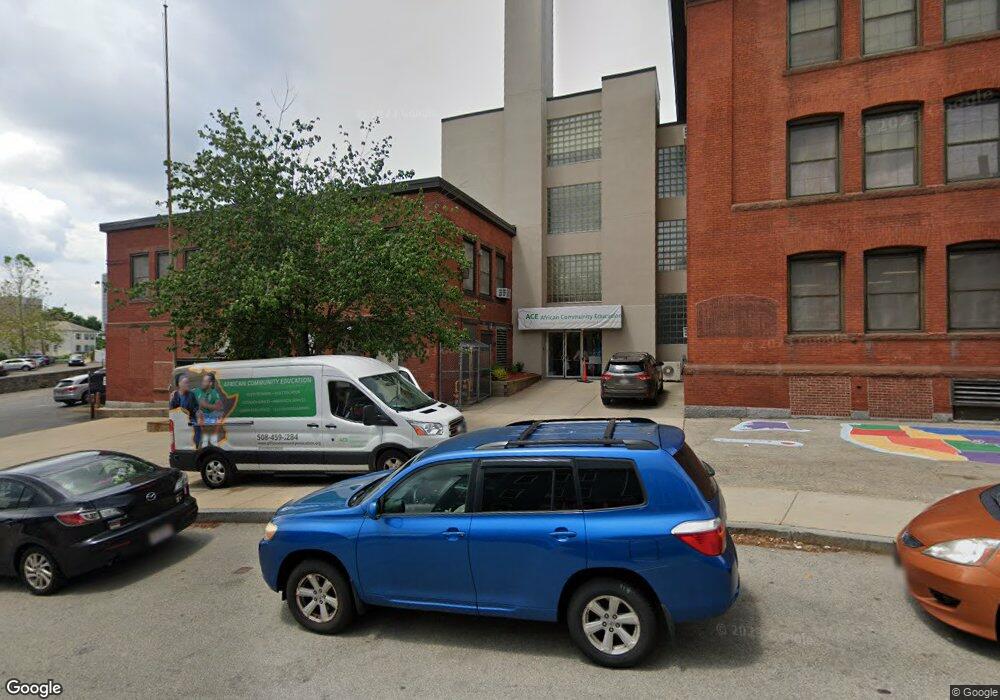
51 Gage St Worcester, MA 01605
Shrewsbury Street Neighborhood
Studio
--
Bath
55,000
Sq Ft
40,946
Sq Ft Lot
About This Home
This home is located at 51 Gage St, Worcester, MA 01605. 51 Gage St is a home located in Worcester County with nearby schools including City View, Jacob Hiatt Magnet School, and Chandler Magnet.
Ownership History
Date
Name
Owned For
Owner Type
Purchase Details
Closed on
Jan 12, 2022
Sold by
Learning First Fndtn Inc
Bought by
Program African Cmnty Edu
Purchase Details
Closed on
Feb 15, 2011
Sold by
Worcester City Of
Bought by
Learning 1St Fndtn Inc
Home Financials for this Owner
Home Financials are based on the most recent Mortgage that was taken out on this home.
Original Mortgage
$575,000
Interest Rate
4.88%
Mortgage Type
Commercial
Purchase Details
Closed on
Mar 29, 1996
Sold by
Worcester City Of
Bought by
Worcester Charter Scho
Create a Home Valuation Report for This Property
The Home Valuation Report is an in-depth analysis detailing your home's value as well as a comparison with similar homes in the area
Home Values in the Area
Average Home Value in this Area
Purchase History
| Date | Buyer | Sale Price | Title Company |
|---|---|---|---|
| Program African Cmnty Edu | $1,800,000 | Misc Company | |
| Learning 1St Fndtn Inc | -- | -- | |
| Learning 1St Fndtn Inc | -- | -- | |
| Worcester Charter Scho | $32,500 | -- |
Source: Public Records
Mortgage History
| Date | Status | Borrower | Loan Amount |
|---|---|---|---|
| Previous Owner | Learning 1St Fndtn Inc | $575,000 | |
| Previous Owner | Learning 1St Fndtn Inc | $2,900,000 |
Source: Public Records
Tax History
| Year | Tax Paid | Tax Assessment Tax Assessment Total Assessment is a certain percentage of the fair market value that is determined by local assessors to be the total taxable value of land and additions on the property. | Land | Improvement |
|---|---|---|---|---|
| 2025 | -- | $6,002,700 | $569,600 | $5,433,100 |
| 2024 | -- | $6,002,700 | $569,600 | $5,433,100 |
| 2023 | $0 | $5,573,100 | $361,200 | $5,211,900 |
| 2022 | $0 | $6,774,100 | $361,200 | $6,412,900 |
| 2021 | $0 | $6,050,100 | $361,200 | $5,688,900 |
| 2020 | $0 | $6,050,100 | $361,200 | $5,688,900 |
| 2019 | $0 | $6,040,500 | $351,600 | $5,688,900 |
| 2018 | $0 | $6,040,500 | $351,600 | $5,688,900 |
| 2017 | $0 | $6,040,500 | $351,600 | $5,688,900 |
| 2016 | -- | $4,170,900 | $309,500 | $3,861,400 |
| 2015 | -- | $4,170,900 | $309,500 | $3,861,400 |
| 2014 | -- | $3,447,800 | $309,500 | $3,138,300 |
Source: Public Records
Map
Nearby Homes
- 78 Gage St
- 80 Mulberry St
- 47 Laurel St
- 1 Verdi Rd
- 107 Eastern Ave
- 247 Shrewsbury St
- 13 Groton Place
- 5 Mcfarland Ct
- 29 Chilmark St
- 115 Orient St
- 145 Eastern Ave
- 24 Ingleside Ave
- Lot 2 Ararat
- 21 Kendall St
- 32 Providence St Unit 5
- 64 Green St
- 24 Catharine St
- 9 Barclay St
- 22 Waverly St
- 22 Elm St Unit 402
Your Personal Tour Guide
Ask me questions while you tour the home.