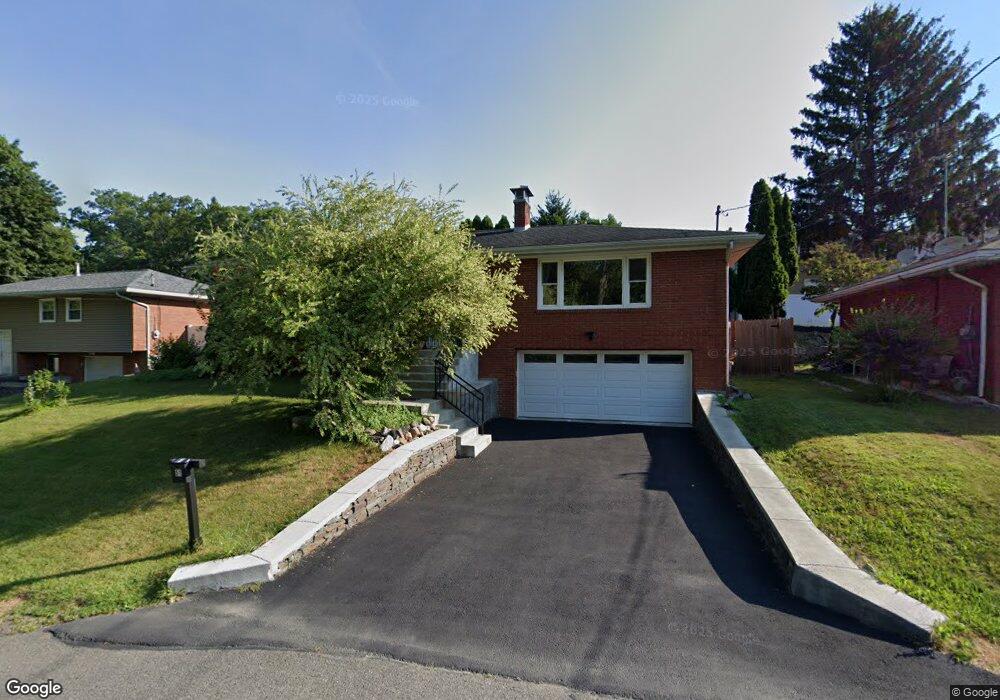
51 Garden Ave Albany, NY 12203
Campus Area NeighborhoodEstimated Value: $337,211 - $370,000
3
Beds
2
Baths
1,512
Sq Ft
$234/Sq Ft
Est. Value
About This Home
This home is located at 51 Garden Ave, Albany, NY 12203 and is currently estimated at $353,053, approximately $233 per square foot. 51 Garden Ave is a home located in Albany County with nearby schools including Eagle Point Elementary School, William S Hackett Middle School, and Albany High School.
Ownership History
Date
Name
Owned For
Owner Type
Purchase Details
Closed on
Jun 6, 2011
Sold by
Arnaud Emammuel P and Arnaud Heidi J
Bought by
Lamphere Mara
Current Estimated Value
Home Financials for this Owner
Home Financials are based on the most recent Mortgage that was taken out on this home.
Original Mortgage
$194,750
Outstanding Balance
$135,385
Interest Rate
4.81%
Estimated Equity
$217,668
Purchase Details
Closed on
Aug 16, 2004
Sold by
Trelle Lena
Bought by
Arnaud Emmanuel P
Create a Home Valuation Report for This Property
The Home Valuation Report is an in-depth analysis detailing your home's value as well as a comparison with similar homes in the area
Home Values in the Area
Average Home Value in this Area
Purchase History
| Date | Buyer | Sale Price | Title Company |
|---|---|---|---|
| Lamphere Mara | $205,000 | None Available | |
| Arnaud Emmanuel P | $158,000 | Susan A Hoblock |
Source: Public Records
Mortgage History
| Date | Status | Borrower | Loan Amount |
|---|---|---|---|
| Open | Lamphere Mara | $194,750 |
Source: Public Records
Tax History Compared to Growth
Tax History
| Year | Tax Paid | Tax Assessment Tax Assessment Total Assessment is a certain percentage of the fair market value that is determined by local assessors to be the total taxable value of land and additions on the property. | Land | Improvement |
|---|---|---|---|---|
| 2024 | $7,104 | $293,000 | $58,600 | $234,400 |
| 2023 | $5,872 | $160,000 | $38,000 | $122,000 |
| 2022 | $5,666 | $160,000 | $38,000 | $122,000 |
| 2021 | $5,628 | $160,000 | $38,000 | $122,000 |
| 2020 | $5,433 | $160,000 | $38,000 | $122,000 |
| 2019 | $6,299 | $160,000 | $38,000 | $122,000 |
| 2018 | $5,435 | $160,000 | $38,000 | $122,000 |
| 2017 | $2,323 | $160,000 | $38,000 | $122,000 |
| 2016 | $5,277 | $160,000 | $38,000 | $122,000 |
| 2015 | $6,625 | $198,100 | $39,600 | $158,500 |
| 2014 | -- | $198,100 | $39,600 | $158,500 |
Source: Public Records
Map
Nearby Homes