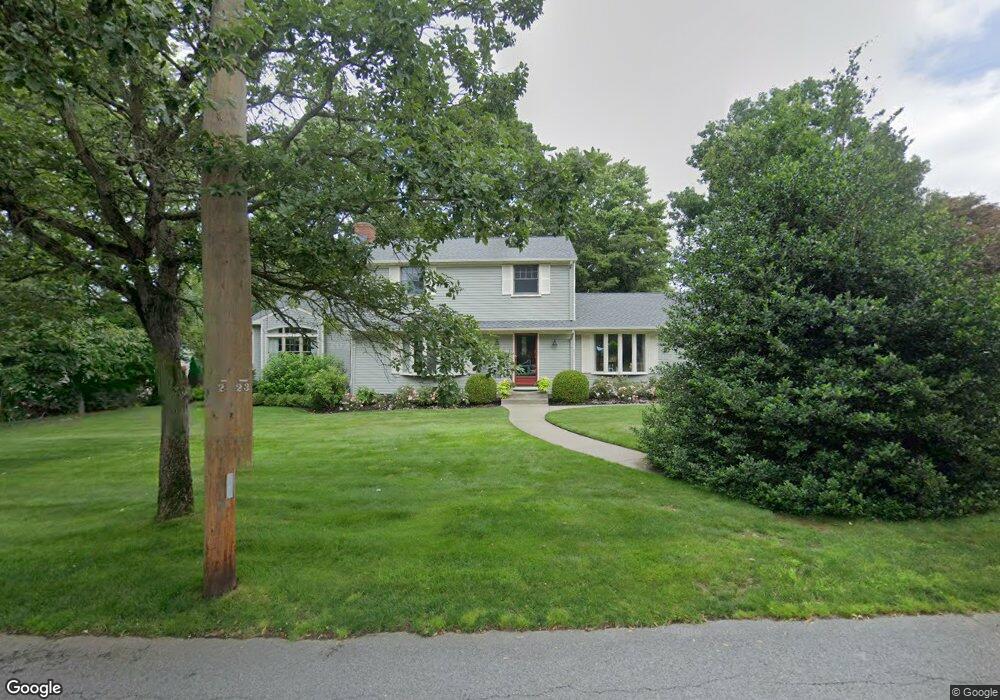
51 Gibson Rd Bristol, RI 02809
Bristol Highlands NeighborhoodEstimated Value: $958,000 - $1,033,000
4
Beds
3
Baths
2,788
Sq Ft
$358/Sq Ft
Est. Value
About This Home
This home is located at 51 Gibson Rd, Bristol, RI 02809 and is currently estimated at $999,322, approximately $358 per square foot. 51 Gibson Rd is a home located in Bristol County with nearby schools including Mt. Hope High School, Highlander Charter Middle and High School, and Our Lady of Mt. Carmel School.
Ownership History
Date
Name
Owned For
Owner Type
Purchase Details
Closed on
Mar 15, 2021
Sold by
Vadnais Kenneth J and Vadnais Doreen
Bought by
Vadnais Ft
Current Estimated Value
Purchase Details
Closed on
Aug 1, 2017
Sold by
Vadnais Kenneth J and Vadnais Doreen
Bought by
Vadnais 2017 Ft
Purchase Details
Closed on
Jan 21, 1992
Sold by
Hynson Lawrence M
Bought by
Vadnais Kenneth J
Home Financials for this Owner
Home Financials are based on the most recent Mortgage that was taken out on this home.
Original Mortgage
$142,000
Interest Rate
8.57%
Purchase Details
Closed on
May 21, 1990
Sold by
Bruno Kenneth J
Bought by
Hynson Lawrence M
Home Financials for this Owner
Home Financials are based on the most recent Mortgage that was taken out on this home.
Original Mortgage
$165,000
Interest Rate
10.14%
Create a Home Valuation Report for This Property
The Home Valuation Report is an in-depth analysis detailing your home's value as well as a comparison with similar homes in the area
Home Values in the Area
Average Home Value in this Area
Purchase History
| Date | Buyer | Sale Price | Title Company |
|---|---|---|---|
| Vadnais Ft | -- | None Available | |
| Vadnais Kenneth J | -- | None Available | |
| Vadnais 2017 Ft | -- | -- | |
| Vadnais Kenneth J | $202,000 | -- | |
| Hynson Lawrence M | $183,000 | -- |
Source: Public Records
Mortgage History
| Date | Status | Borrower | Loan Amount |
|---|---|---|---|
| Previous Owner | Hynson Lawrence M | $310,000 | |
| Previous Owner | Hynson Lawrence M | $129,000 | |
| Previous Owner | Hynson Lawrence M | $142,000 | |
| Previous Owner | Hynson Lawrence M | $165,000 |
Source: Public Records
Tax History Compared to Growth
Tax History
| Year | Tax Paid | Tax Assessment Tax Assessment Total Assessment is a certain percentage of the fair market value that is determined by local assessors to be the total taxable value of land and additions on the property. | Land | Improvement |
|---|---|---|---|---|
| 2025 | $7,546 | $546,000 | $249,000 | $297,000 |
| 2024 | $7,546 | $546,000 | $249,000 | $297,000 |
| 2023 | $7,295 | $546,000 | $249,000 | $297,000 |
| 2022 | $7,098 | $546,000 | $249,000 | $297,000 |
| 2021 | $7,059 | $490,900 | $247,400 | $243,500 |
| 2020 | $6,907 | $490,900 | $247,400 | $243,500 |
| 2019 | $6,735 | $490,900 | $247,400 | $243,500 |
| 2018 | $6,681 | $434,400 | $249,100 | $185,300 |
| 2017 | $5,750 | $385,400 | $225,000 | $160,400 |
| 2016 | $5,692 | $385,400 | $225,000 | $160,400 |
| 2015 | $5,407 | $385,400 | $225,000 | $160,400 |
| 2014 | $6,087 | $466,110 | $302,700 | $163,410 |
Source: Public Records
Map
Nearby Homes
- 61 Mulberry Rd
- 17 Shore Rd
- 0 Surf Dr
- 40 Aaron Ave
- 1220 Hope St
- 1 Knowlton Ct
- 7 Knowlton Ct
- 3 Knowlton Ct
- 5 Knowlton Ct
- 94 Windward Ln
- 3 Chestnut St
- 669 Metacom Ave Unit 17
- 2 Bagy Wrinkle Cove
- 683 Metacom Ave Unit 79
- 53 Bagy Wrinkle Cove
- 35 Bagy Wrinkle Cove
- 413 High St
- 6 Scott Ln
- 48 Narrows Rd
- 85 Canario Dr