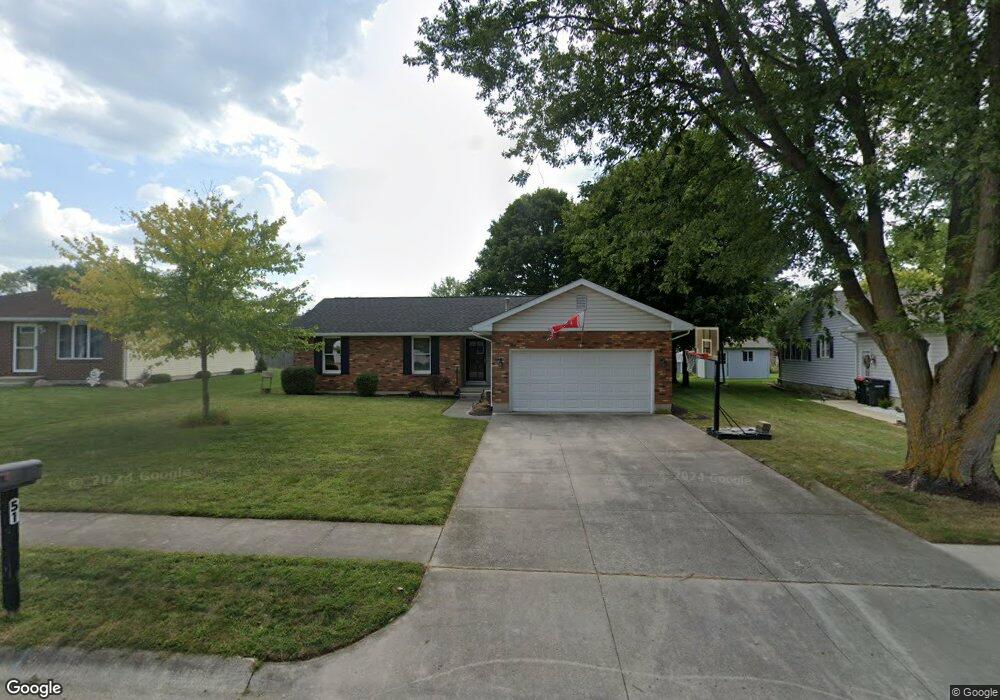
51 Hiawatha Ct Versailles, OH 45380
Estimated Value: $230,000 - $309,000
3
Beds
2
Baths
1,254
Sq Ft
$208/Sq Ft
Est. Value
About This Home
This home is located at 51 Hiawatha Ct, Versailles, OH 45380 and is currently estimated at $260,737, approximately $207 per square foot. 51 Hiawatha Ct is a home located in Darke County with nearby schools including Versailles Elementary School, Versailles Middle School, and Versailles High School.
Ownership History
Date
Name
Owned For
Owner Type
Purchase Details
Closed on
Oct 2, 2015
Sold by
Knapke Ryan S and Knapke Kara L
Bought by
Mumaw Kevin M
Current Estimated Value
Home Financials for this Owner
Home Financials are based on the most recent Mortgage that was taken out on this home.
Original Mortgage
$142,000
Outstanding Balance
$100,931
Interest Rate
3.84%
Mortgage Type
New Conventional
Estimated Equity
$159,806
Purchase Details
Closed on
Oct 10, 2008
Sold by
Henry Nancy G
Bought by
Knapke Ryan S
Home Financials for this Owner
Home Financials are based on the most recent Mortgage that was taken out on this home.
Original Mortgage
$103,500
Interest Rate
4.75%
Mortgage Type
Purchase Money Mortgage
Purchase Details
Closed on
Oct 1, 1989
Bought by
Mumaw Kevin M
Purchase Details
Closed on
Aug 1, 1987
Bought by
Mumaw Kevin M
Create a Home Valuation Report for This Property
The Home Valuation Report is an in-depth analysis detailing your home's value as well as a comparison with similar homes in the area
Home Values in the Area
Average Home Value in this Area
Purchase History
| Date | Buyer | Sale Price | Title Company |
|---|---|---|---|
| Mumaw Kevin M | $213,000 | Attorney | |
| Knapke Ryan S | $115,000 | Attorney | |
| Mumaw Kevin M | $65,000 | -- | |
| Mumaw Kevin M | $61,000 | -- |
Source: Public Records
Mortgage History
| Date | Status | Borrower | Loan Amount |
|---|---|---|---|
| Open | Mumaw Kevin M | $142,000 | |
| Previous Owner | Knapke Ryan S | $103,500 |
Source: Public Records
Tax History Compared to Growth
Tax History
| Year | Tax Paid | Tax Assessment Tax Assessment Total Assessment is a certain percentage of the fair market value that is determined by local assessors to be the total taxable value of land and additions on the property. | Land | Improvement |
|---|---|---|---|---|
| 2024 | $2,123 | $63,720 | $8,900 | $54,820 |
| 2023 | $2,128 | $63,720 | $8,900 | $54,820 |
| 2022 | $1,682 | $49,440 | $7,420 | $42,020 |
| 2021 | $1,758 | $49,440 | $7,420 | $42,020 |
| 2020 | $1,769 | $49,440 | $7,420 | $42,020 |
| 2019 | $1,647 | $45,550 | $7,420 | $38,130 |
| 2018 | $1,656 | $45,550 | $7,420 | $38,130 |
| 2017 | $1,579 | $45,550 | $7,420 | $38,130 |
| 2016 | $1,183 | $44,910 | $7,420 | $37,490 |
| 2015 | $1,183 | $33,580 | $7,420 | $26,160 |
| 2014 | $1,121 | $33,580 | $7,420 | $26,160 |
| 2013 | $1,197 | $33,580 | $7,420 | $26,160 |
Source: Public Records
Map
Nearby Homes
- 0 St Rt 121 Unit 10041143
- 632 N Center St
- 631 N Center St
- 59 W Ward St
- 552 Reed Ave
- 546 Reed Ave
- 0 Ohio 121
- 129 E Wood St
- 547 Reed Ave
- 16 E Ward St
- 435 Reed Ave
- 447 Reed Ave
- 304 E Wood St
- 0000 Marker Rd
- 00 State Route 121
- 8839 Murphy Rd
- Tract 4 Rd
- 9072 Stillwater Dr
- 8832 State Route 185
- 8363 Horatio-New Harrison Rd
- 63 Hiawatha Ct
- 37 Hiawatha Ct
- 971 Jackson St
- 77 Hiawatha Ct
- 991 Jackson St
- 1007 Jackson St
- 54 Hiawatha Ct
- 15 Hiawatha Ct
- 955 Jackson St
- 346 Catalpa Dr
- 91 Hiawatha Ct
- 943 Jackson St
- 6 Hiawatha Ct
- 90 Hiawatha Ct
- 270 Catalpa Dr
- 378 Catalpa Dr
- 95 Hiawatha Ct
- 254 Catalpa Dr
- 295 Catalpa Dr
- 100 Hiawatha Ct