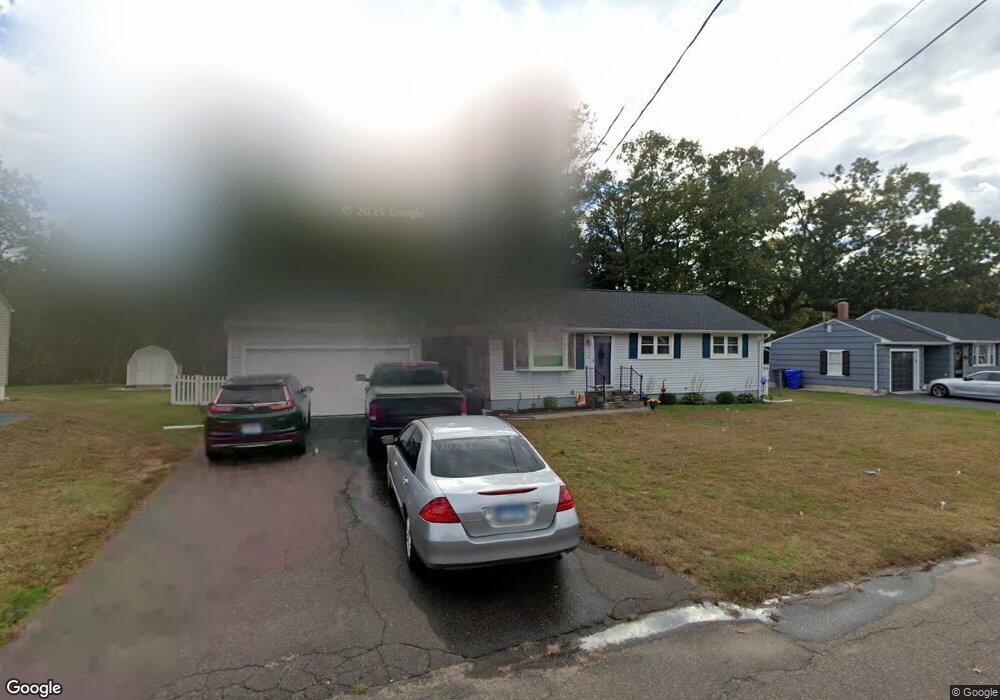
51 Indian Run Enfield, CT 06082
Estimated Value: $280,000 - $315,000
3
Beds
2
Baths
960
Sq Ft
$310/Sq Ft
Est. Value
About This Home
This home is located at 51 Indian Run, Enfield, CT 06082 and is currently estimated at $297,306, approximately $309 per square foot. 51 Indian Run is a home located in Hartford County with nearby schools including Eli Whitney Elementary School, Hazardville Memorial Elementary School, and John F. Kennedy Middle School.
Ownership History
Date
Name
Owned For
Owner Type
Purchase Details
Closed on
Jun 18, 2007
Sold by
Flynn Michael and Flynn Stacey
Bought by
Mangino Chris and Greci Amber
Current Estimated Value
Home Financials for this Owner
Home Financials are based on the most recent Mortgage that was taken out on this home.
Original Mortgage
$182,400
Interest Rate
6.19%
Purchase Details
Closed on
Jan 7, 2002
Sold by
Mezzanotte John
Bought by
Babij Stacey and Flynn Michael
Create a Home Valuation Report for This Property
The Home Valuation Report is an in-depth analysis detailing your home's value as well as a comparison with similar homes in the area
Home Values in the Area
Average Home Value in this Area
Purchase History
| Date | Buyer | Sale Price | Title Company |
|---|---|---|---|
| Mangino Chris | $228,000 | -- | |
| Babij Stacey | $122,500 | -- |
Source: Public Records
Mortgage History
| Date | Status | Borrower | Loan Amount |
|---|---|---|---|
| Open | Babij Stacey | $172,763 | |
| Closed | Babij Stacey | $182,400 | |
| Closed | Babij Stacey | $20,600 |
Source: Public Records
Tax History Compared to Growth
Tax History
| Year | Tax Paid | Tax Assessment Tax Assessment Total Assessment is a certain percentage of the fair market value that is determined by local assessors to be the total taxable value of land and additions on the property. | Land | Improvement |
|---|---|---|---|---|
| 2025 | $5,093 | $145,100 | $56,400 | $88,700 |
| 2024 | $4,906 | $145,100 | $56,400 | $88,700 |
| 2023 | $4,870 | $145,100 | $56,400 | $88,700 |
| 2022 | $4,482 | $145,100 | $56,400 | $88,700 |
| 2021 | $4,287 | $114,110 | $46,660 | $67,450 |
| 2020 | $4,259 | $114,110 | $46,660 | $67,450 |
| 2019 | $4,253 | $114,110 | $46,660 | $67,450 |
| 2018 | $4,139 | $114,110 | $46,660 | $67,450 |
| 2017 | $3,889 | $114,110 | $46,660 | $67,450 |
| 2016 | $3,956 | $118,580 | $47,880 | $70,700 |
| 2015 | $3,835 | $118,580 | $47,880 | $70,700 |
| 2014 | $3,739 | $118,580 | $47,880 | $70,700 |
Source: Public Records
Map
Nearby Homes
- 10-1/2 South Rd
- 23 Clear St
- 46 Beech Rd
- 84 Raffia Rd
- 30 David St
- 83 Oldefield Farms Unit 83
- 85 Oldefield Farms Unit 85
- 33 Liberty Ln
- 38 Liberty Ln
- 52 Liberty Ln
- 37 Liberty Ln
- 35 Liberty Ln
- 3 Avon Street Extension
- 287 Hazard Ave
- 92 Post Office Rd
- 6 Cedar St
- 233 Post Office Rd
- 4 Georgetown Unit A
- 34 Ridgefield Rd
- 4 Bradley Cir Unit D