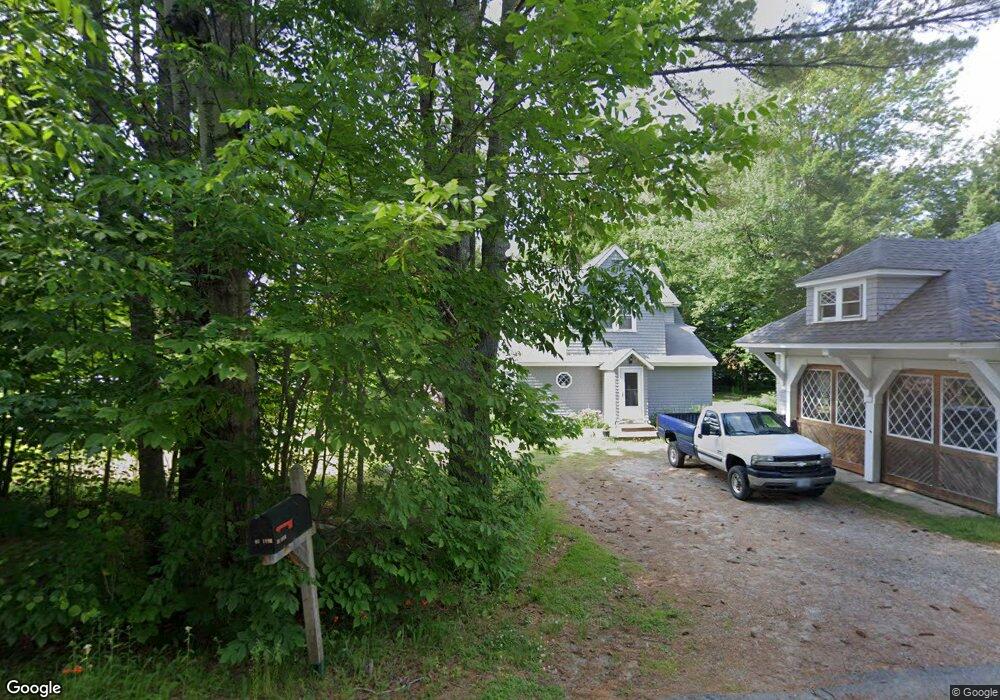
51 Ivie Ln Bethlehem, NH 03574
Estimated Value: $303,000 - $409,000
3
Beds
2
Baths
1,438
Sq Ft
$262/Sq Ft
Est. Value
About This Home
This home is located at 51 Ivie Ln, Bethlehem, NH 03574 and is currently estimated at $376,428, approximately $261 per square foot. 51 Ivie Ln is a home located in Grafton County with nearby schools including Bethlehem Elementary School, Profile Junior High School, and Profile Senior High School.
Ownership History
Date
Name
Owned For
Owner Type
Purchase Details
Closed on
Mar 4, 2020
Sold by
Whitcher Jason M and Whitcher Jennifer R
Bought by
Whitcher Jennifer R
Current Estimated Value
Purchase Details
Closed on
Sep 16, 2004
Sold by
Crafts Patricia
Bought by
Whitcher Jason M
Home Financials for this Owner
Home Financials are based on the most recent Mortgage that was taken out on this home.
Original Mortgage
$186,542
Interest Rate
6.02%
Mortgage Type
Purchase Money Mortgage
Create a Home Valuation Report for This Property
The Home Valuation Report is an in-depth analysis detailing your home's value as well as a comparison with similar homes in the area
Home Values in the Area
Average Home Value in this Area
Purchase History
| Date | Buyer | Sale Price | Title Company |
|---|---|---|---|
| Whitcher Jennifer R | -- | None Available | |
| Whitcher Jason M | $207,500 | -- |
Source: Public Records
Mortgage History
| Date | Status | Borrower | Loan Amount |
|---|---|---|---|
| Previous Owner | Whitcher Jason M | $185,250 | |
| Previous Owner | Whitcher Jason M | $18,000 | |
| Previous Owner | Whitcher Jason M | $186,542 |
Source: Public Records
Tax History Compared to Growth
Tax History
| Year | Tax Paid | Tax Assessment Tax Assessment Total Assessment is a certain percentage of the fair market value that is determined by local assessors to be the total taxable value of land and additions on the property. | Land | Improvement |
|---|---|---|---|---|
| 2024 | $6,068 | $353,200 | $86,400 | $266,800 |
| 2023 | $5,450 | $353,200 | $86,400 | $266,800 |
| 2022 | $4,059 | $169,900 | $27,100 | $142,800 |
| 2021 | $4,356 | $175,700 | $27,100 | $148,600 |
| 2020 | $4,428 | $175,700 | $27,100 | $148,600 |
| 2019 | $4,696 | $175,700 | $27,100 | $148,600 |
| 2018 | $4,563 | $175,700 | $27,100 | $148,600 |
| 2017 | $4,786 | $155,800 | $30,000 | $125,800 |
| 2016 | $4,278 | $155,800 | $30,000 | $125,800 |
| 2015 | $4,615 | $155,800 | $30,000 | $125,800 |
| 2013 | $4,448 | $155,800 | $30,000 | $125,800 |
Source: Public Records
Map
Nearby Homes
- 95 Noyes St
- 2254 Main St
- 0 Churchill Ln Unit 167
- O Main St
- 28 Jodo Way
- 42 Maple St
- 14 Reid Cir
- 15 Okane Ave
- 16 3rd St
- 757 Maple St
- 00 Swazey Ln Unit 14
- 105 Alpenhof Rd
- 000 Ridge Rd
- 00 Ridge Rd
- 206 Lewis Hill Rd
- Map 202-Lot 39 Parker Rd
- 00 Moose Trail Rd Unit 560000
- 686 Wing Rd
- 78 Hazen Rd
- 528 Trudeau Rd