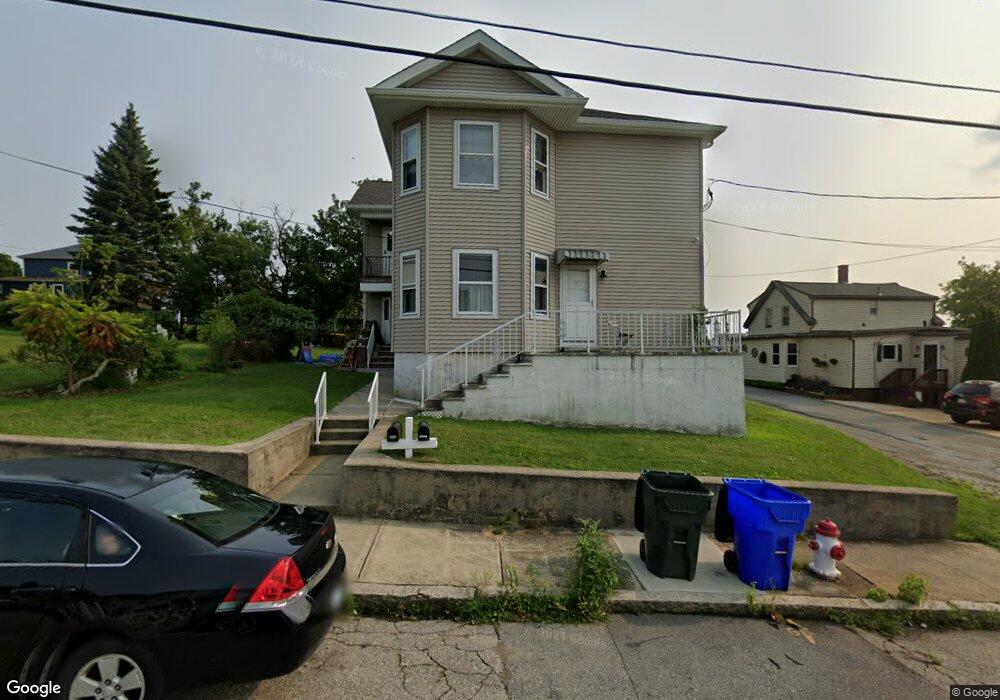
51 Last St Fall River, MA 02724
Sandy Beach NeighborhoodEstimated Value: $500,621 - $570,000
6
Beds
2
Baths
2,992
Sq Ft
$178/Sq Ft
Est. Value
About This Home
This home is located at 51 Last St, Fall River, MA 02724 and is currently estimated at $531,655, approximately $177 per square foot. 51 Last St is a home located in Bristol County with nearby schools including Henry Lord Community School, B M C Durfee High School, and Argosy Collegiate Charter School.
Ownership History
Date
Name
Owned For
Owner Type
Purchase Details
Closed on
Jun 9, 2020
Sold by
Frias Mary E and Frias Allan W
Bought by
Defaria Brandon
Current Estimated Value
Home Financials for this Owner
Home Financials are based on the most recent Mortgage that was taken out on this home.
Original Mortgage
$216,000
Outstanding Balance
$190,144
Interest Rate
3.3%
Mortgage Type
New Conventional
Estimated Equity
$341,511
Purchase Details
Closed on
Mar 31, 2020
Sold by
Jessie Frias Ret
Bought by
Frias Allan W and Frias Mery E
Purchase Details
Closed on
Apr 5, 2019
Sold by
Frias Mary E and Frias Allan W
Bought by
Jessie Frias Ret and Frias
Purchase Details
Closed on
Jul 31, 2018
Sold by
Frias Mary E and Garlick Carolyn
Bought by
Frias Allan W and Frias Mary E
Home Financials for this Owner
Home Financials are based on the most recent Mortgage that was taken out on this home.
Original Mortgage
$136,000
Interest Rate
4.25%
Mortgage Type
Adjustable Rate Mortgage/ARM
Create a Home Valuation Report for This Property
The Home Valuation Report is an in-depth analysis detailing your home's value as well as a comparison with similar homes in the area
Home Values in the Area
Average Home Value in this Area
Purchase History
| Date | Buyer | Sale Price | Title Company |
|---|---|---|---|
| Defaria Brandon | $270,000 | None Available | |
| Frias Allan W | -- | None Available | |
| Jessie Frias Ret | -- | -- | |
| Frias Allan W | $130,000 | -- |
Source: Public Records
Mortgage History
| Date | Status | Borrower | Loan Amount |
|---|---|---|---|
| Open | Defaria Brandon | $216,000 | |
| Previous Owner | Frias Allan W | $136,000 |
Source: Public Records
Tax History
| Year | Tax Paid | Tax Assessment Tax Assessment Total Assessment is a certain percentage of the fair market value that is determined by local assessors to be the total taxable value of land and additions on the property. | Land | Improvement |
|---|---|---|---|---|
| 2025 | $5,673 | $495,500 | $124,300 | $371,200 |
| 2024 | $5,173 | $450,200 | $121,900 | $328,300 |
| 2023 | $4,837 | $394,200 | $109,800 | $284,400 |
| 2022 | $4,464 | $353,700 | $103,600 | $250,100 |
| 2021 | $4,228 | $305,700 | $99,000 | $206,700 |
| 2020 | $3,501 | $242,300 | $94,400 | $147,900 |
| 2019 | $3,324 | $228,000 | $98,700 | $129,300 |
| 2018 | $3,104 | $212,300 | $99,400 | $112,900 |
| 2017 | $2,881 | $205,800 | $99,400 | $106,400 |
| 2016 | $2,809 | $206,100 | $102,500 | $103,600 |
| 2015 | $2,696 | $206,100 | $102,500 | $103,600 |
| 2014 | $2,715 | $215,800 | $102,500 | $113,300 |
Source: Public Records
Map
Nearby Homes
Your Personal Tour Guide
Ask me questions while you tour the home.