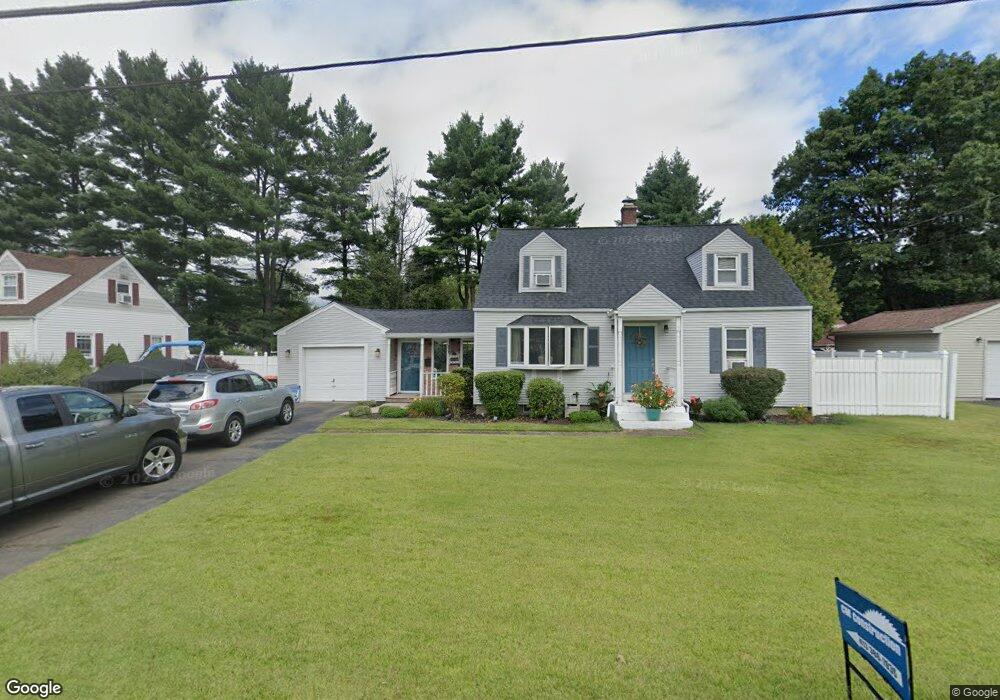
51 Laurie Ave South Hadley, MA 01075
Estimated Value: $335,000 - $372,943
3
Beds
1
Bath
1,181
Sq Ft
$306/Sq Ft
Est. Value
About This Home
This home is located at 51 Laurie Ave, South Hadley, MA 01075 and is currently estimated at $361,236, approximately $305 per square foot. 51 Laurie Ave is a home located in Hampshire County with nearby schools including Plains Elementary School, Mosier Elementary School, and Michael E. Smith Middle School.
Ownership History
Date
Name
Owned For
Owner Type
Purchase Details
Closed on
Jul 31, 2007
Sold by
Avgoustakis Amelie E and Avgoustakis Jason E
Bought by
Wiernasz Laurie and Avgoustakis Mark E
Current Estimated Value
Home Financials for this Owner
Home Financials are based on the most recent Mortgage that was taken out on this home.
Original Mortgage
$210,917
Interest Rate
6.78%
Mortgage Type
Purchase Money Mortgage
Purchase Details
Closed on
Dec 6, 2004
Sold by
Avgoustakis Jason E
Bought by
Avgoustakis Jason E and Avgoustakis Amelie E
Home Financials for this Owner
Home Financials are based on the most recent Mortgage that was taken out on this home.
Original Mortgage
$155,000
Interest Rate
5.69%
Mortgage Type
Purchase Money Mortgage
Purchase Details
Closed on
Apr 27, 2001
Sold by
Boucher Barbara B and Boucher Paul R
Bought by
Avgoustakis Jason E
Create a Home Valuation Report for This Property
The Home Valuation Report is an in-depth analysis detailing your home's value as well as a comparison with similar homes in the area
Home Values in the Area
Average Home Value in this Area
Purchase History
| Date | Buyer | Sale Price | Title Company |
|---|---|---|---|
| Wiernasz Laurie | $225,000 | -- | |
| Avgoustakis Jason E | -- | -- | |
| Avgoustakis Jason E | $150,000 | -- |
Source: Public Records
Mortgage History
| Date | Status | Borrower | Loan Amount |
|---|---|---|---|
| Open | Avgoustakis Jason E | $215,433 | |
| Closed | Wiernasz Laurie | $210,917 | |
| Previous Owner | Avgoustakis Jason E | $155,000 | |
| Previous Owner | Avgoustakis Jason E | $20,400 |
Source: Public Records
Tax History Compared to Growth
Tax History
| Year | Tax Paid | Tax Assessment Tax Assessment Total Assessment is a certain percentage of the fair market value that is determined by local assessors to be the total taxable value of land and additions on the property. | Land | Improvement |
|---|---|---|---|---|
| 2025 | $4,785 | $300,400 | $94,100 | $206,300 |
| 2024 | $4,657 | $279,700 | $87,900 | $191,800 |
| 2023 | $4,445 | $253,300 | $79,900 | $173,400 |
| 2022 | $4,232 | $229,000 | $79,900 | $149,100 |
| 2021 | $4,166 | $214,100 | $74,700 | $139,400 |
| 2020 | $4,078 | $204,500 | $74,700 | $129,800 |
| 2019 | $3,974 | $197,200 | $71,100 | $126,100 |
| 2018 | $3,821 | $191,700 | $69,000 | $122,700 |
| 2017 | $3,682 | $183,000 | $69,000 | $114,000 |
| 2016 | $3,672 | $185,000 | $69,000 | $116,000 |
| 2015 | $3,485 | $179,800 | $67,000 | $112,800 |
Source: Public Records
Map
Nearby Homes