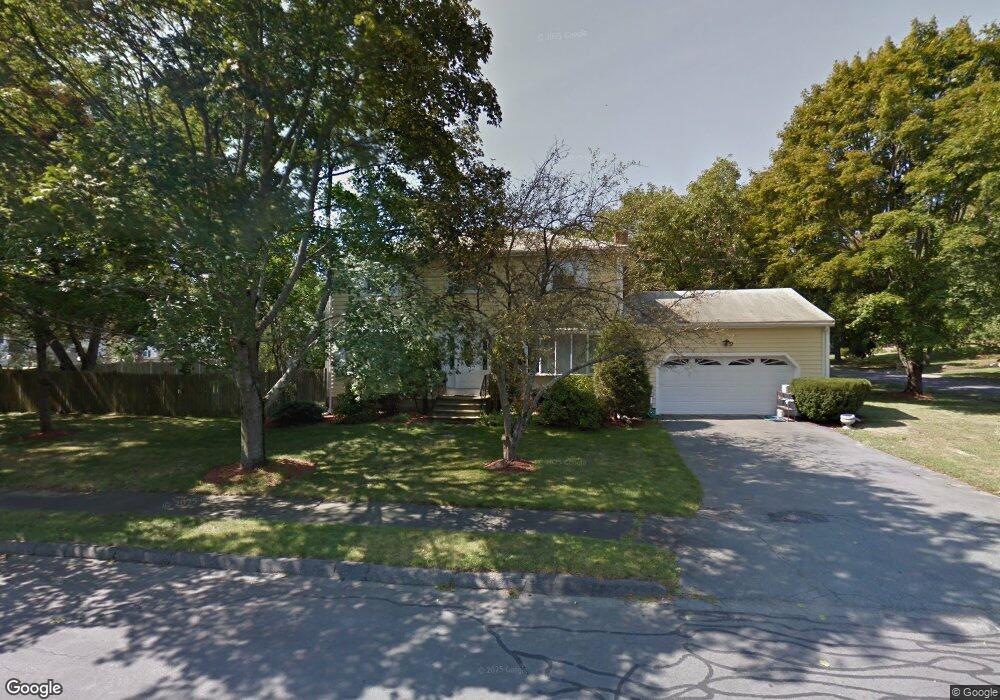
51 Ledgewood Dr Danvers, MA 01923
Estimated Value: $965,352 - $1,073,000
4
Beds
3
Baths
3,000
Sq Ft
$342/Sq Ft
Est. Value
About This Home
This home is located at 51 Ledgewood Dr, Danvers, MA 01923 and is currently estimated at $1,025,588, approximately $341 per square foot. 51 Ledgewood Dr is a home located in Essex County with nearby schools including Danvers High School, St. Mary of the Annunciation School, and St. John's Prep.
Ownership History
Date
Name
Owned For
Owner Type
Purchase Details
Closed on
Dec 28, 2007
Sold by
Risk June D and Risk Timothy F
Bought by
Giannarakis George and Giannarakis Peggy
Current Estimated Value
Home Financials for this Owner
Home Financials are based on the most recent Mortgage that was taken out on this home.
Original Mortgage
$417,000
Interest Rate
6.27%
Mortgage Type
Purchase Money Mortgage
Purchase Details
Closed on
Apr 3, 2003
Sold by
Risk Timothy F
Bought by
Risk June D
Purchase Details
Closed on
Dec 1, 1987
Sold by
Hayes David L
Bought by
Risk Timothy F
Create a Home Valuation Report for This Property
The Home Valuation Report is an in-depth analysis detailing your home's value as well as a comparison with similar homes in the area
Home Values in the Area
Average Home Value in this Area
Purchase History
| Date | Buyer | Sale Price | Title Company |
|---|---|---|---|
| Giannarakis George | $575,000 | -- | |
| Risk June D | -- | -- | |
| Risk Timothy F | $315,000 | -- |
Source: Public Records
Mortgage History
| Date | Status | Borrower | Loan Amount |
|---|---|---|---|
| Open | Risk Timothy F | $397,650 | |
| Closed | Risk Timothy F | $417,000 |
Source: Public Records
Tax History
| Year | Tax Paid | Tax Assessment Tax Assessment Total Assessment is a certain percentage of the fair market value that is determined by local assessors to be the total taxable value of land and additions on the property. | Land | Improvement |
|---|---|---|---|---|
| 2025 | $9,321 | $848,100 | $405,100 | $443,000 |
| 2024 | $9,170 | $825,400 | $398,400 | $427,000 |
| 2023 | $8,810 | $749,800 | $364,600 | $385,200 |
| 2022 | $8,633 | $681,900 | $324,100 | $357,800 |
| 2021 | $8,472 | $634,600 | $320,100 | $314,500 |
| 2020 | $8,288 | $634,600 | $320,100 | $314,500 |
| 2019 | $7,911 | $595,700 | $290,400 | $305,300 |
| 2018 | $7,764 | $573,400 | $290,400 | $283,000 |
| 2017 | $7,298 | $514,300 | $249,900 | $264,400 |
| 2016 | $7,013 | $493,900 | $236,400 | $257,500 |
| 2015 | $6,803 | $456,300 | $216,100 | $240,200 |
Source: Public Records
Map
Nearby Homes
Your Personal Tour Guide
Ask me questions while you tour the home.