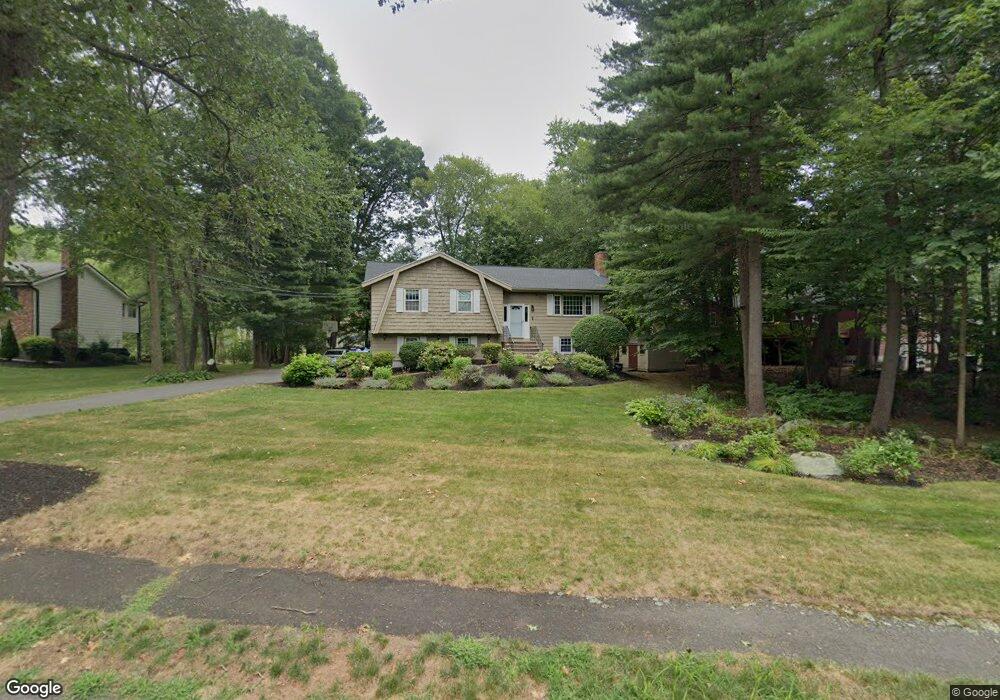
51 Longbow Rd Danvers, MA 01923
Estimated Value: $888,000 - $955,000
3
Beds
3
Baths
2,557
Sq Ft
$363/Sq Ft
Est. Value
About This Home
This home is located at 51 Longbow Rd, Danvers, MA 01923 and is currently estimated at $928,242, approximately $363 per square foot. 51 Longbow Rd is a home located in Essex County with nearby schools including Danvers High School, St. Mary of the Annunciation School, and St. John's Prep.
Ownership History
Date
Name
Owned For
Owner Type
Purchase Details
Closed on
Apr 13, 2016
Sold by
Leahy Thomas D
Bought by
Leahy Pamela J
Current Estimated Value
Home Financials for this Owner
Home Financials are based on the most recent Mortgage that was taken out on this home.
Original Mortgage
$281,000
Interest Rate
3.64%
Mortgage Type
New Conventional
Purchase Details
Closed on
Oct 15, 1993
Sold by
Smith James F and Smith Patricia
Bought by
Leahy Thomas D and Leahy Pamela
Create a Home Valuation Report for This Property
The Home Valuation Report is an in-depth analysis detailing your home's value as well as a comparison with similar homes in the area
Home Values in the Area
Average Home Value in this Area
Purchase History
| Date | Buyer | Sale Price | Title Company |
|---|---|---|---|
| Leahy Pamela J | -- | -- | |
| Leahy Thomas D | $230,000 | -- |
Source: Public Records
Mortgage History
| Date | Status | Borrower | Loan Amount |
|---|---|---|---|
| Closed | Leahy Pamela J | $281,000 | |
| Previous Owner | Leahy Thomas D | $215,000 | |
| Previous Owner | Leahy Thomas D | $193,500 | |
| Previous Owner | Leahy Thomas D | $50,000 |
Source: Public Records
Tax History Compared to Growth
Tax History
| Year | Tax Paid | Tax Assessment Tax Assessment Total Assessment is a certain percentage of the fair market value that is determined by local assessors to be the total taxable value of land and additions on the property. | Land | Improvement |
|---|---|---|---|---|
| 2025 | $8,745 | $795,700 | $405,300 | $390,400 |
| 2024 | $8,073 | $726,600 | $398,500 | $328,100 |
| 2023 | $7,818 | $665,400 | $364,700 | $300,700 |
| 2022 | $7,596 | $600,000 | $324,200 | $275,800 |
| 2021 | $7,957 | $596,000 | $320,200 | $275,800 |
| 2020 | $7,784 | $596,000 | $320,200 | $275,800 |
| 2019 | $7,519 | $566,200 | $290,400 | $275,800 |
| 2018 | $7,241 | $534,800 | $290,400 | $244,400 |
| 2017 | $6,763 | $476,600 | $249,900 | $226,700 |
| 2016 | $6,576 | $463,100 | $236,400 | $226,700 |
| 2015 | $6,314 | $423,500 | $216,100 | $207,400 |
Source: Public Records
Map
Nearby Homes
- 78 North St
- 12 Exeter St
- 11 Spring St
- 6 Colby Rd
- 39 Roosevelt Ave
- 10 Paulette Dr
- 42 Coolidge Rd
- 35 Locust St Unit 3
- 4 Butler Ave
- 6 Kimberly Dr
- 11 Reservoir Dr
- 320 Newbury St Unit 304
- 12 Central Ave Unit 1
- 14 Williams St Unit C17
- 38 High St Unit 4
- 35 High St Unit 3D
- 200 North St Unit 31A
- 200 North St
- 7 Riverbank Ave Unit 7
- 7 Riverbank Ave