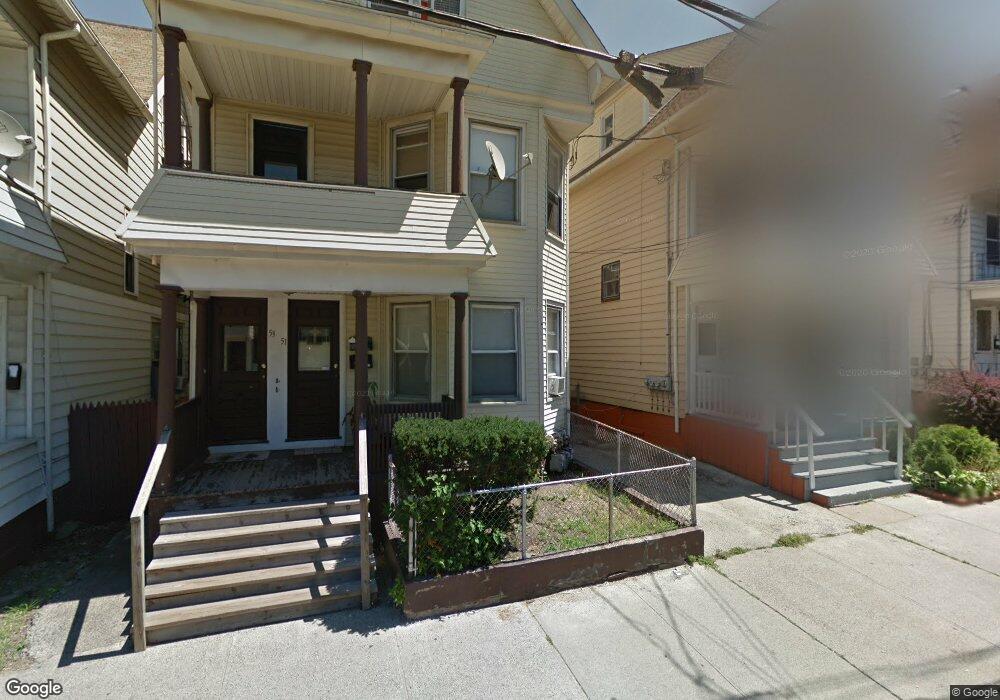
51 Maltby Place New Haven, CT 06513
Fair Haven NeighborhoodEstimated Value: $319,289 - $424,000
7
Beds
2
Baths
3,234
Sq Ft
$122/Sq Ft
Est. Value
About This Home
This home is located at 51 Maltby Place, New Haven, CT 06513 and is currently estimated at $394,572, approximately $122 per square foot. 51 Maltby Place is a home located in New Haven County with nearby schools including Elm City College Preparatory School, Cold Spring School, and St Francis & St Rose Of Lima School.
Ownership History
Date
Name
Owned For
Owner Type
Purchase Details
Closed on
Sep 9, 2009
Sold by
Thomas Bryant and Flores Julio
Bought by
Gonzalez Ramon
Current Estimated Value
Purchase Details
Closed on
Jun 25, 2009
Sold by
Us Bank Na
Bought by
Thomas Bryant
Purchase Details
Closed on
Sep 19, 2008
Sold by
Hilton Rosette
Bought by
Us Bank Na
Purchase Details
Closed on
Aug 23, 2004
Sold by
Ct Hsng Co Llc
Bought by
Hilton Rosette B
Home Financials for this Owner
Home Financials are based on the most recent Mortgage that was taken out on this home.
Original Mortgage
$162,000
Interest Rate
6.03%
Purchase Details
Closed on
Apr 29, 2004
Sold by
Ayala Felix M
Bought by
Connecticut Hsg Co Llc
Home Financials for this Owner
Home Financials are based on the most recent Mortgage that was taken out on this home.
Original Mortgage
$80,000
Interest Rate
15%
Create a Home Valuation Report for This Property
The Home Valuation Report is an in-depth analysis detailing your home's value as well as a comparison with similar homes in the area
Home Values in the Area
Average Home Value in this Area
Purchase History
| Date | Buyer | Sale Price | Title Company |
|---|---|---|---|
| Gonzalez Ramon | $120,000 | -- | |
| Thomas Bryant | $50,100 | -- | |
| Us Bank Na | -- | -- | |
| Hilton Rosette B | $180,000 | -- | |
| Connecticut Hsg Co Llc | $100,000 | -- |
Source: Public Records
Mortgage History
| Date | Status | Borrower | Loan Amount |
|---|---|---|---|
| Previous Owner | Connecticut Hsg Co Llc | $235,800 | |
| Previous Owner | Connecticut Hsg Co Llc | $162,000 | |
| Previous Owner | Connecticut Hsg Co Llc | $80,000 |
Source: Public Records
Tax History Compared to Growth
Tax History
| Year | Tax Paid | Tax Assessment Tax Assessment Total Assessment is a certain percentage of the fair market value that is determined by local assessors to be the total taxable value of land and additions on the property. | Land | Improvement |
|---|---|---|---|---|
| 2025 | $6,495 | $164,850 | $26,600 | $138,250 |
| 2024 | $6,347 | $164,850 | $26,600 | $138,250 |
| 2023 | $6,132 | $164,850 | $26,600 | $138,250 |
| 2022 | $6,553 | $164,850 | $26,600 | $138,250 |
| 2021 | $4,137 | $94,290 | $21,280 | $73,010 |
| 2020 | $4,137 | $94,290 | $21,280 | $73,010 |
| 2019 | $4,053 | $94,290 | $21,280 | $73,010 |
| 2018 | $4,053 | $94,290 | $21,280 | $73,010 |
| 2017 | $3,647 | $94,290 | $21,280 | $73,010 |
| 2016 | $3,153 | $75,880 | $14,210 | $61,670 |
| 2015 | $3,153 | $75,880 | $14,210 | $61,670 |
| 2014 | $3,153 | $75,880 | $14,210 | $61,670 |
Source: Public Records
Map
Nearby Homes