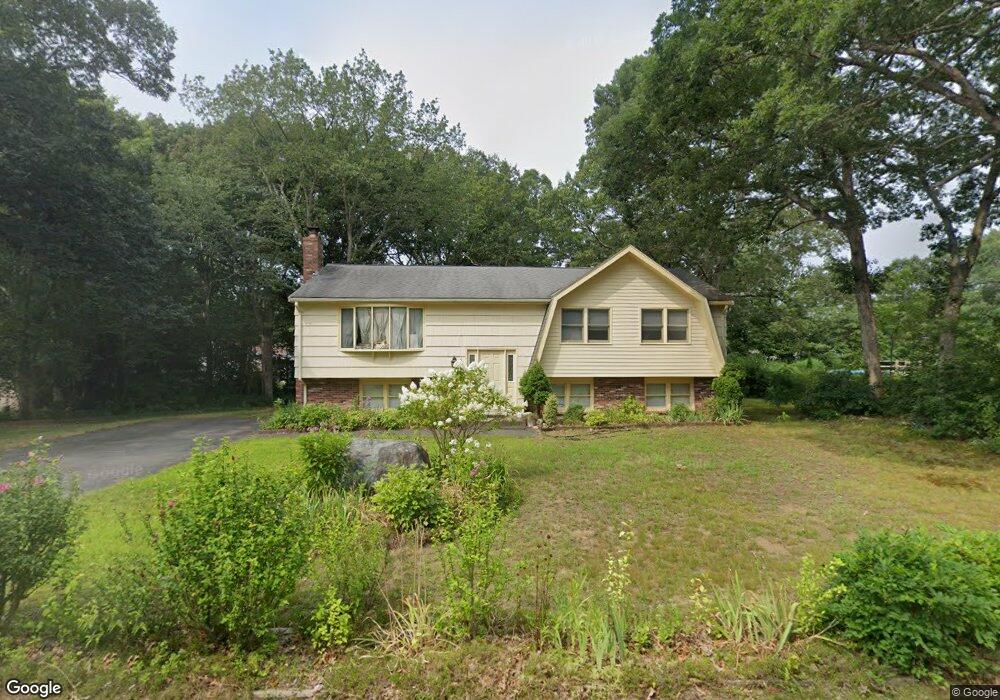
51 Maxim St Brockton, MA 02301
Estimated Value: $489,000 - $645,000
3
Beds
2
Baths
1,824
Sq Ft
$314/Sq Ft
Est. Value
About This Home
This home is located at 51 Maxim St, Brockton, MA 02301 and is currently estimated at $571,937, approximately $313 per square foot. 51 Maxim St is a home located in Plymouth County with nearby schools including Louis F Angelo Elementary School, Raymond K-8 Elementary School, and Hancock Elementary School.
Ownership History
Date
Name
Owned For
Owner Type
Purchase Details
Closed on
Dec 11, 2018
Sold by
Duong Luong B and Nguyen Anh A
Bought by
Duong Nguyen Lt
Current Estimated Value
Purchase Details
Closed on
Jul 1, 2014
Sold by
Duong Luong B
Bought by
Duong Luong B and Nguyen Anh A
Create a Home Valuation Report for This Property
The Home Valuation Report is an in-depth analysis detailing your home's value as well as a comparison with similar homes in the area
Home Values in the Area
Average Home Value in this Area
Purchase History
| Date | Buyer | Sale Price | Title Company |
|---|---|---|---|
| Duong Nguyen Lt | -- | -- | |
| Duong Luong B | -- | -- |
Source: Public Records
Tax History Compared to Growth
Tax History
| Year | Tax Paid | Tax Assessment Tax Assessment Total Assessment is a certain percentage of the fair market value that is determined by local assessors to be the total taxable value of land and additions on the property. | Land | Improvement |
|---|---|---|---|---|
| 2025 | $6,400 | $528,500 | $165,200 | $363,300 |
| 2024 | $6,307 | $524,700 | $165,200 | $359,500 |
| 2023 | $6,272 | $483,200 | $131,500 | $351,700 |
| 2022 | $5,726 | $409,900 | $120,200 | $289,700 |
| 2021 | $5,303 | $365,700 | $107,800 | $257,900 |
| 2020 | $5,416 | $357,500 | $103,300 | $254,200 |
| 2019 | $5,475 | $352,300 | $95,900 | $256,400 |
| 2018 | $4,873 | $303,400 | $95,900 | $207,500 |
| 2017 | $4,584 | $284,700 | $95,900 | $188,800 |
| 2016 | $5,027 | $289,600 | $92,500 | $197,100 |
| 2015 | $4,826 | $265,900 | $92,500 | $173,400 |
| 2014 | $5,013 | $276,500 | $92,500 | $184,000 |
Source: Public Records
Map
Nearby Homes