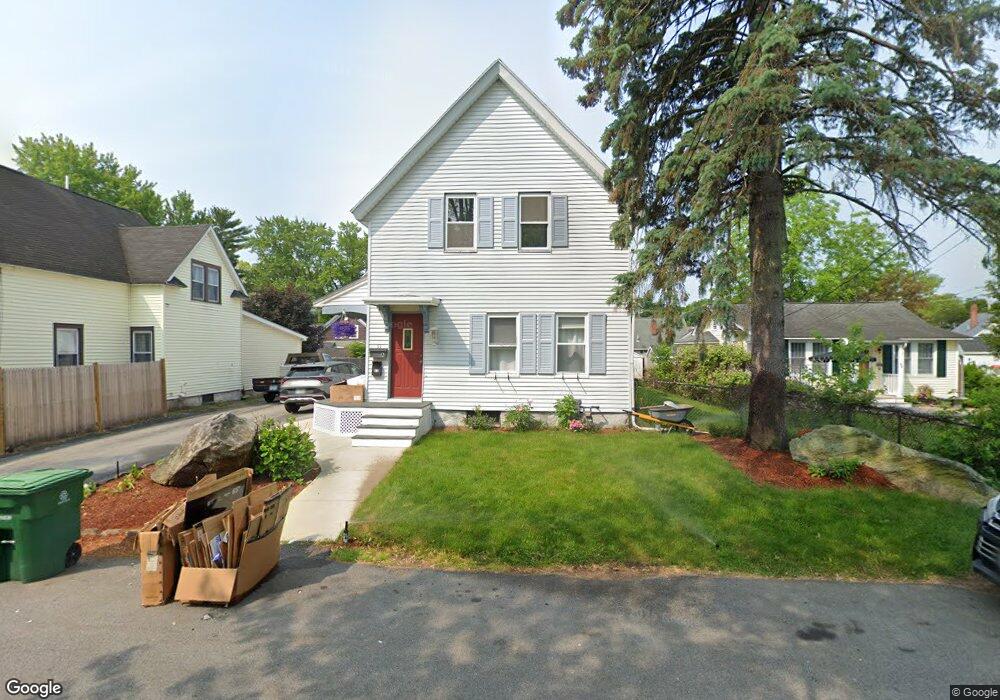
51 Monroe St Nashua, NH 03060
South End Nashua NeighborhoodEstimated Value: $536,480 - $607,000
4
Beds
2
Baths
2,256
Sq Ft
$249/Sq Ft
Est. Value
About This Home
This home is located at 51 Monroe St, Nashua, NH 03060 and is currently estimated at $561,120, approximately $248 per square foot. 51 Monroe St is a home located in Hillsborough County with nearby schools including Fairgrounds Elementary School, Fairgrounds Middle School, and Nashua High School South.
Ownership History
Date
Name
Owned For
Owner Type
Purchase Details
Closed on
Dec 20, 2001
Sold by
Vandervort Wilbert M and Vandervort Constance L
Bought by
Rodriguez Jacqueline
Current Estimated Value
Home Financials for this Owner
Home Financials are based on the most recent Mortgage that was taken out on this home.
Original Mortgage
$176,800
Interest Rate
6.54%
Mortgage Type
Purchase Money Mortgage
Purchase Details
Closed on
Jun 26, 1997
Sold by
Chabot Ronald R and Chabot Gloria J
Bought by
Vandervort Wilbert M and Vandervort Constance L
Home Financials for this Owner
Home Financials are based on the most recent Mortgage that was taken out on this home.
Original Mortgage
$113,250
Interest Rate
7.81%
Mortgage Type
Purchase Money Mortgage
Create a Home Valuation Report for This Property
The Home Valuation Report is an in-depth analysis detailing your home's value as well as a comparison with similar homes in the area
Home Values in the Area
Average Home Value in this Area
Purchase History
| Date | Buyer | Sale Price | Title Company |
|---|---|---|---|
| Rodriguez Jacqueline | $221,000 | -- | |
| Vandervort Wilbert M | $116,500 | -- |
Source: Public Records
Mortgage History
| Date | Status | Borrower | Loan Amount |
|---|---|---|---|
| Open | Vandervort Wilbert M | $198,000 | |
| Closed | Vandervort Wilbert M | $176,800 | |
| Previous Owner | Vandervort Wilbert M | $113,250 |
Source: Public Records
Tax History Compared to Growth
Tax History
| Year | Tax Paid | Tax Assessment Tax Assessment Total Assessment is a certain percentage of the fair market value that is determined by local assessors to be the total taxable value of land and additions on the property. | Land | Improvement |
|---|---|---|---|---|
| 2024 | $7,397 | $465,200 | $137,100 | $328,100 |
| 2023 | $7,188 | $394,300 | $109,600 | $284,700 |
| 2022 | $7,125 | $394,300 | $109,600 | $284,700 |
| 2021 | $5,879 | $253,200 | $73,100 | $180,100 |
| 2020 | $4,559 | $250,800 | $73,100 | $177,700 |
| 2019 | $4,307 | $250,800 | $73,100 | $177,700 |
| 2018 | $5,319 | $250,800 | $73,100 | $177,700 |
| 2017 | $5,341 | $207,100 | $67,800 | $139,300 |
| 2016 | $4,148 | $207,100 | $67,800 | $139,300 |
| 2015 | $5,080 | $207,100 | $67,800 | $139,300 |
| 2014 | $4,981 | $207,100 | $67,800 | $139,300 |
Source: Public Records
Map
Nearby Homes
- 97 Linwood St
- 22 Kern Dr
- 63 Dexter St
- 169A W Hollis St Unit 193
- 22 New Dunstable Rd Unit 132133
- 11 Bordeaux St
- 41 New Dunstable Rd Unit 371
- 4 Badger St
- 22 Wilder St
- 15 Lovell St Unit 20
- 15 Lovell St Unit 3
- 15 Lovell St Unit 7
- 15 Lovell St Unit 10
- 8 Buck St Unit 10
- 30 Ledge St
- 38 Central St
- 6 Hayden St
- 5 Mulberry St
- 15 Learned St Unit 123
- 17 Herrick St