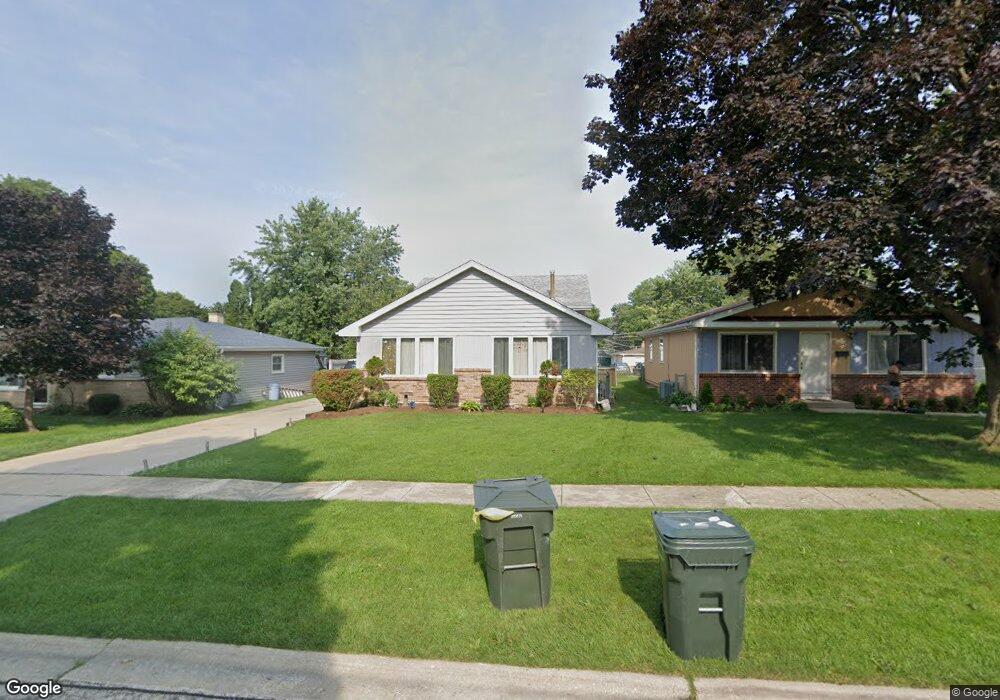
51 N Idlewild Ave Mundelein, IL 60060
Estimated Value: $356,000 - $413,274
3
Beds
2
Baths
1,604
Sq Ft
$239/Sq Ft
Est. Value
About This Home
This home is located at 51 N Idlewild Ave, Mundelein, IL 60060 and is currently estimated at $383,819, approximately $239 per square foot. 51 N Idlewild Ave is a home located in Lake County with nearby schools including Washington Early Learning Center, Mechanics Grove Elementary School, and Carl Sandburg Middle School.
Ownership History
Date
Name
Owned For
Owner Type
Purchase Details
Closed on
Aug 14, 2019
Sold by
Hansen Rita
Bought by
Warrender Phyllis I and The Phyllis I Warrender Revoca
Current Estimated Value
Purchase Details
Closed on
Jul 20, 2001
Sold by
Warrender Phyllis I
Bought by
Hansen Rita
Purchase Details
Closed on
Jun 1, 2001
Sold by
Warrender Joseph D
Bought by
Warrender Phylli I
Purchase Details
Closed on
Jan 29, 1997
Sold by
Kujala John M and Kujala Dorothy M
Bought by
Warrender Joseph D and Warrender Phyllis I
Home Financials for this Owner
Home Financials are based on the most recent Mortgage that was taken out on this home.
Original Mortgage
$142,600
Interest Rate
7.81%
Purchase Details
Closed on
Jan 30, 1995
Sold by
Kujala John M and Kujala Dorothy M
Bought by
Kujala John M and Kujala Dorothy M
Create a Home Valuation Report for This Property
The Home Valuation Report is an in-depth analysis detailing your home's value as well as a comparison with similar homes in the area
Home Values in the Area
Average Home Value in this Area
Purchase History
| Date | Buyer | Sale Price | Title Company |
|---|---|---|---|
| Warrender Phyllis I | -- | None Available | |
| Hansen Rita | $191,000 | First American Title | |
| Warrender Phylli I | -- | Chicago Title Insurance Co | |
| Warrender Joseph D | $172,000 | Chicago Title Insurance Co | |
| Kujala John M | -- | -- |
Source: Public Records
Mortgage History
| Date | Status | Borrower | Loan Amount |
|---|---|---|---|
| Previous Owner | Warrender Joseph D | $142,600 |
Source: Public Records
Tax History Compared to Growth
Tax History
| Year | Tax Paid | Tax Assessment Tax Assessment Total Assessment is a certain percentage of the fair market value that is determined by local assessors to be the total taxable value of land and additions on the property. | Land | Improvement |
|---|---|---|---|---|
| 2024 | $11,449 | $126,394 | $15,690 | $110,704 |
| 2023 | $9,405 | $115,809 | $14,376 | $101,433 |
| 2022 | $9,405 | $93,425 | $12,620 | $80,805 |
| 2021 | $8,995 | $90,153 | $12,178 | $77,975 |
| 2020 | $8,848 | $87,672 | $11,843 | $75,829 |
| 2019 | $8,564 | $84,790 | $11,454 | $73,336 |
| 2018 | $9,165 | $84,148 | $10,775 | $73,373 |
| 2017 | $9,060 | $81,499 | $10,436 | $71,063 |
| 2016 | $8,862 | $77,405 | $9,912 | $67,493 |
| 2015 | $8,687 | $72,565 | $9,292 | $63,273 |
| 2014 | $8,375 | $71,293 | $9,209 | $62,084 |
| 2012 | $8,528 | $71,926 | $9,291 | $62,635 |
Source: Public Records
Map
Nearby Homes
- 207 N Idlewild Ave
- 116 S Pershing Ave
- 250 N Fairlawn Ave
- 1297 Spalding Dr
- 1305 Spalding Dr
- 26220 N Midlothian Rd
- 201 Bingham Cir
- 208 Bingham Cir
- 29746 U S 45
- 547 N Ridgemoor Ave
- 26980 N Pierre Dr
- 1360 Edington Ln
- 123 Dunton Ct
- 19925 W Il Route 60
- 851 Glenview Ave
- 619 N California Ave Unit 1
- 26892 N Iride Dr
- 728 W Maple Ave
- 19738 W Martin Dr
- 331 Plaza Cir
- 45 N Idlewild Ave
- 57 N Idlewild Ave
- 63 N Idlewild Ave
- 39 N Idlewild Ave
- 52 N California Ave
- 58 N California Ave
- 46 N California Ave
- 33 N Idlewild Ave
- 64 N California Ave
- 40 N California Ave
- 52 N Idlewild Ave
- 27 N Idlewild Ave
- 46 N Idlewild Ave
- 58 N Idlewild Ave
- 721 W Crystal St
- 34 N California Ave
- 64 N Idlewild Ave
- 40 N Idlewild Ave
- 16 N California Ave
- 34 N Idlewild Ave