Estimated Value: $133,668 - $180,000
Studio
1
Bath
1,535
Sq Ft
$105/Sq Ft
Est. Value
About This Home
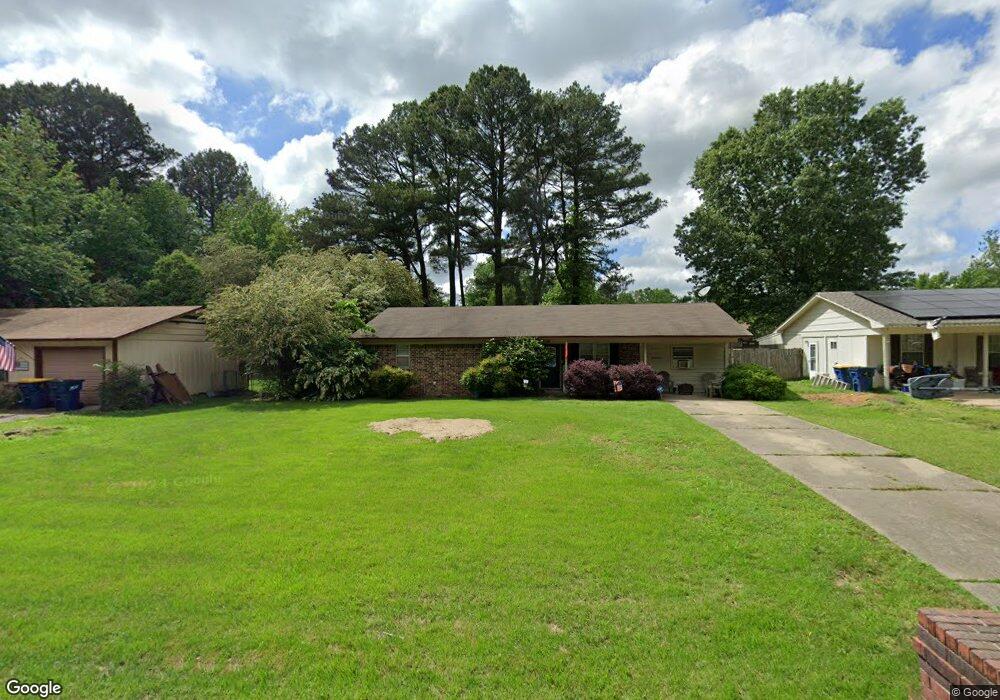
This home is located at 51 Pheasant Run Dr, Cabot, AR 72023 and is currently estimated at $161,417, approximately $105 per square foot. 51 Pheasant Run Dr is a home located in Lonoke County with nearby schools including Westside Elementary School, Cabot Junior High South, and Cabot Middle School South.
Ownership History
Date
Name
Owned For
Owner Type
Purchase Details
Closed on
Jul 23, 2008
Sold by
Brooks Rebecca and Lantrip Rebecca
Bought by
Overton Shawn A and Overton Alicia J
Current Estimated Value
Home Financials for this Owner
Home Financials are based on the most recent Mortgage that was taken out on this home.
Original Mortgage
$72,895
Interest Rate
6.36%
Purchase Details
Closed on
Jul 10, 2008
Sold by
Brooks Rebecca and Lantrip Rebecca
Bought by
Overton Shawn A and Overton Alicia J
Home Financials for this Owner
Home Financials are based on the most recent Mortgage that was taken out on this home.
Original Mortgage
$72,895
Interest Rate
6.36%
Purchase Details
Closed on
Oct 1, 1993
Bought by
Lantrip
Purchase Details
Closed on
Oct 5, 1990
Bought by
Mongno
Purchase Details
Closed on
Oct 7, 1982
Bought by
Westmoreland
Purchase Details
Closed on
Jun 29, 1982
Bought by
Utley
Create a Home Valuation Report for This Property
The Home Valuation Report is an in-depth analysis detailing your home's value as well as a comparison with similar homes in the area
Purchase History
| Date | Buyer | Sale Price | Title Company |
|---|---|---|---|
| Overton Shawn A | -- | -- | |
| Overton Shawn A | -- | -- | |
| Lantrip | $45,000 | -- | |
| Lantrip | $45,000 | -- | |
| Mongno | $40,000 | -- | |
| Westmoreland | $37,000 | -- | |
| Utley | -- | -- |
Source: Public Records
Mortgage History
| Date | Status | Borrower | Loan Amount |
|---|---|---|---|
| Closed | Overton Shawn A | $72,895 | |
| Closed | Overton Shawn A | $72,895 |
Source: Public Records
Tax History
| Year | Tax Paid | Tax Assessment Tax Assessment Total Assessment is a certain percentage of the fair market value that is determined by local assessors to be the total taxable value of land and additions on the property. | Land | Improvement |
|---|---|---|---|---|
| 2025 | $442 | $17,040 | $2,000 | $15,040 |
| 2024 | $442 | $17,040 | $2,000 | $15,040 |
| 2023 | $442 | $17,040 | $2,000 | $15,040 |
| 2022 | $492 | $17,040 | $2,000 | $15,040 |
| 2021 | $492 | $17,040 | $2,000 | $15,040 |
| 2020 | $458 | $16,370 | $2,000 | $14,370 |
| 2019 | $458 | $16,370 | $2,000 | $14,370 |
| 2018 | $459 | $16,370 | $2,000 | $14,370 |
| 2017 | $751 | $16,370 | $2,000 | $14,370 |
| 2016 | $459 | $16,370 | $2,000 | $14,370 |
| 2015 | $508 | $17,360 | $2,000 | $15,360 |
| 2014 | $508 | $17,360 | $2,000 | $15,360 |
Source: Public Records
Map
Nearby Homes
- 20 Paige Ave
- 28 Pheasant Run Dr
- 92 Sycamore Cir
- 19 Trinity Dr
- 30 Mcarthur Dr
- 49 Oak Meadows Dr
- 2213 S 2nd St
- 37 Saint John St
- 34 Bent Tree Dr
- 00 Kerr Station Rd
- 12 Bellaire Dr
- 38 S 10th St
- 51 Fieldcrest Cir
- 51 Nevada Ln
- 30 Park Cir
- 51 Meadowlark Dr
- 921 Villa Vista Loop
- 39 Nevada Ln
- 2405 Canterbury Ln
- 64 Saint John St
- 53 Pheasant Run Dr
- 49 Pheasant Run Dr
- 18 Paige Ave
- 55 Pheasant Run Dr
- 47 Pheasant Run Dr
- 16 Paige Ave
- 62 Pheasant Run Dr
- 22 Paige Ave
- 60 Pheasant Run Dr
- 14 Paige Ave
- 58 Pheasant Run Dr
- 45 Pheasant Run Dr
- 57 Pheasant Run Dr
- 24 Paige Ave
- 13 Paige Ave
- 56 Pheasant Run Dr
- 68 Pheasant Run Dr
- 0 Pheasant Run
- 12 Paige Ave
- 15 Paige Ave
Your Personal Tour Guide
Ask me questions while you tour the home.