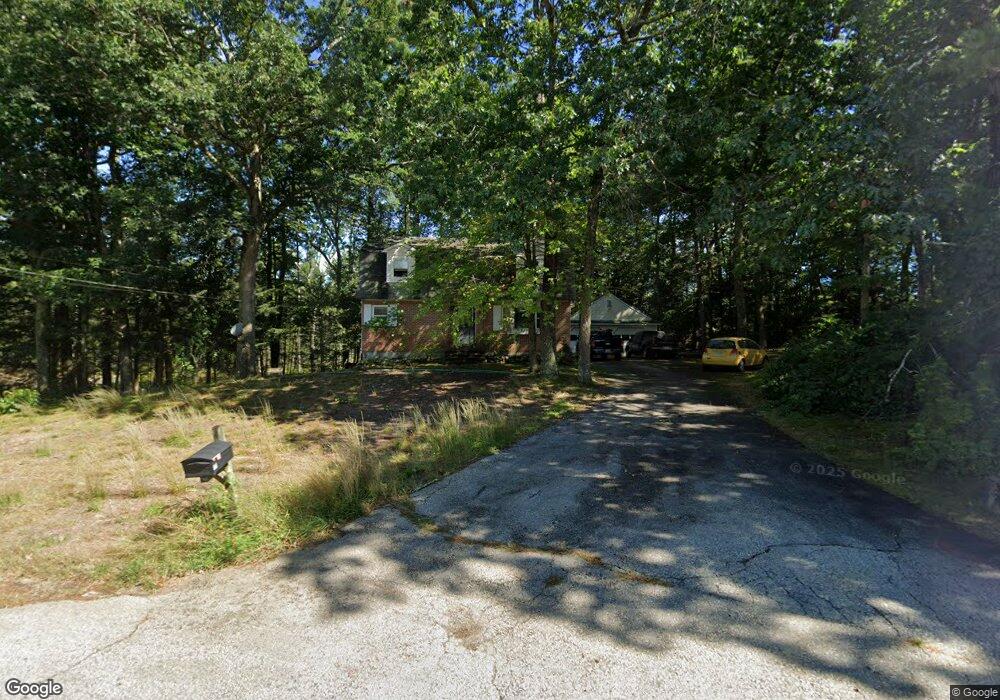
51 Pond Ln Fremont, NH 03044
Estimated Value: $505,000 - $558,000
3
Beds
2
Baths
1,668
Sq Ft
$325/Sq Ft
Est. Value
About This Home
This home is located at 51 Pond Ln, Fremont, NH 03044 and is currently estimated at $542,674, approximately $325 per square foot. 51 Pond Ln is a home located in Rockingham County with nearby schools including Ellis School.
Ownership History
Date
Name
Owned For
Owner Type
Purchase Details
Closed on
Dec 28, 1999
Sold by
F Longo & Son Bldrs Ll
Bought by
Daly Michael P and Daly Rebecca L
Current Estimated Value
Home Financials for this Owner
Home Financials are based on the most recent Mortgage that was taken out on this home.
Original Mortgage
$125,900
Outstanding Balance
$39,310
Interest Rate
7.61%
Estimated Equity
$503,364
Create a Home Valuation Report for This Property
The Home Valuation Report is an in-depth analysis detailing your home's value as well as a comparison with similar homes in the area
Home Values in the Area
Average Home Value in this Area
Purchase History
| Date | Buyer | Sale Price | Title Company |
|---|---|---|---|
| Daly Michael P | $133,900 | -- |
Source: Public Records
Mortgage History
| Date | Status | Borrower | Loan Amount |
|---|---|---|---|
| Open | Daly Michael P | $50,000 | |
| Open | Daly Michael P | $125,900 |
Source: Public Records
Tax History Compared to Growth
Tax History
| Year | Tax Paid | Tax Assessment Tax Assessment Total Assessment is a certain percentage of the fair market value that is determined by local assessors to be the total taxable value of land and additions on the property. | Land | Improvement |
|---|---|---|---|---|
| 2024 | $7,811 | $296,200 | $121,400 | $174,800 |
| 2023 | $6,987 | $296,200 | $121,400 | $174,800 |
| 2022 | $6,869 | $296,200 | $121,400 | $174,800 |
| 2021 | $6,611 | $296,200 | $121,400 | $174,800 |
| 2020 | $6,851 | $296,200 | $121,400 | $174,800 |
| 2019 | $6,809 | $219,300 | $86,400 | $132,900 |
| 2018 | $6,447 | $219,300 | $86,400 | $132,900 |
| 2017 | $6,401 | $219,300 | $86,400 | $132,900 |
| 2016 | $6,553 | $219,300 | $86,400 | $132,900 |
| 2015 | $6,360 | $219,300 | $86,400 | $132,900 |
| 2014 | $6,575 | $233,000 | $86,400 | $146,600 |
| 2013 | $6,643 | $233,000 | $86,400 | $146,600 |
Source: Public Records
Map
Nearby Homes