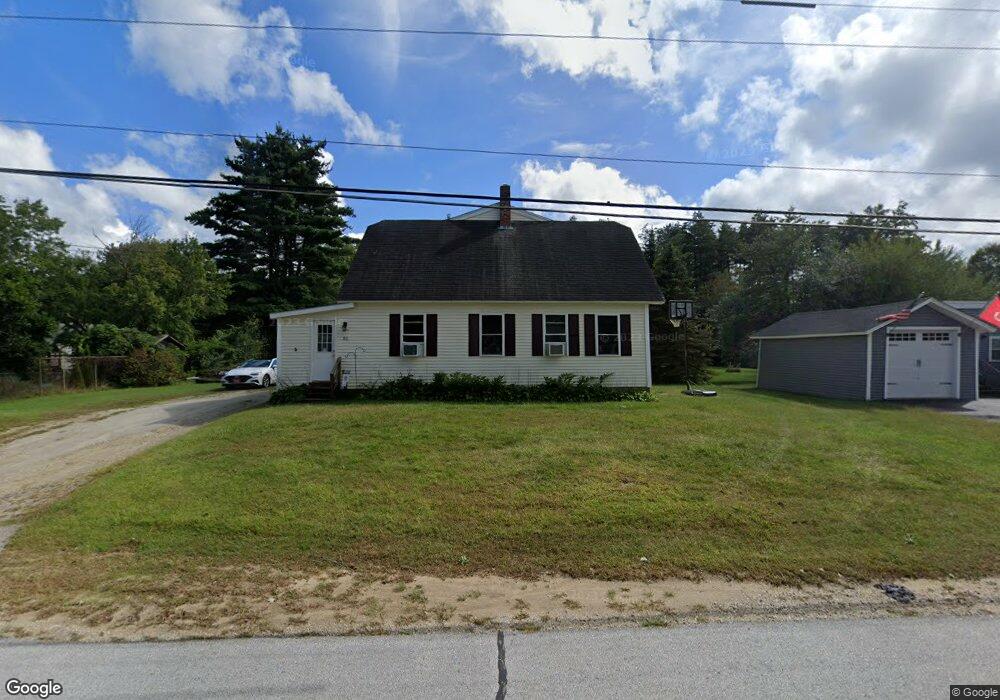
51 River Rd Allenstown, NH 03275
Estimated Value: $462,000 - $576,658
6
Beds
2
Baths
3,546
Sq Ft
$146/Sq Ft
Est. Value
About This Home
This home is located at 51 River Rd, Allenstown, NH 03275 and is currently estimated at $518,165, approximately $146 per square foot. 51 River Rd is a home located in Merrimack County with nearby schools including Allenstown Elementary School, Armand R. Dupont School, and Tender Years Child Care & Learning Center.
Ownership History
Date
Name
Owned For
Owner Type
Purchase Details
Closed on
Sep 3, 2024
Sold by
Lafleur Kimberly A
Bought by
Lafleur Roger A and Lafleur Coleby J
Current Estimated Value
Home Financials for this Owner
Home Financials are based on the most recent Mortgage that was taken out on this home.
Original Mortgage
$276,000
Outstanding Balance
$264,359
Interest Rate
6.07%
Mortgage Type
Stand Alone Refi Refinance Of Original Loan
Estimated Equity
$253,806
Create a Home Valuation Report for This Property
The Home Valuation Report is an in-depth analysis detailing your home's value as well as a comparison with similar homes in the area
Home Values in the Area
Average Home Value in this Area
Purchase History
| Date | Buyer | Sale Price | Title Company |
|---|---|---|---|
| Lafleur Roger A | -- | None Available | |
| Lafleur Roger A | -- | None Available | |
| Lafleur Roger A | -- | None Available |
Source: Public Records
Mortgage History
| Date | Status | Borrower | Loan Amount |
|---|---|---|---|
| Open | Lafleur Roger A | $276,000 | |
| Closed | Lafleur Roger A | $0 |
Source: Public Records
Tax History Compared to Growth
Tax History
| Year | Tax Paid | Tax Assessment Tax Assessment Total Assessment is a certain percentage of the fair market value that is determined by local assessors to be the total taxable value of land and additions on the property. | Land | Improvement |
|---|---|---|---|---|
| 2024 | $11,322 | $445,400 | $140,800 | $304,600 |
| 2023 | $9,457 | $446,100 | $140,800 | $305,300 |
| 2022 | $8,699 | $446,100 | $140,800 | $305,300 |
| 2021 | $8,401 | $266,700 | $85,100 | $181,600 |
| 2020 | $7,814 | $266,700 | $85,100 | $181,600 |
| 2019 | $8,294 | $266,700 | $85,100 | $181,600 |
| 2018 | $8,041 | $266,700 | $85,100 | $181,600 |
| 2017 | $8,564 | $266,700 | $85,100 | $181,600 |
| 2016 | $7,930 | $234,200 | $58,000 | $176,200 |
| 2015 | $7,686 | $234,100 | $58,000 | $176,100 |
| 2014 | $7,908 | $234,100 | $58,000 | $176,100 |
| 2013 | $7,381 | $234,100 | $58,000 | $176,100 |
Source: Public Records
Map
Nearby Homes
- 19 Sullivan Dr
- 10 Lane Dr
- 2 Cheryl Dr
- 1 1/2 Bartlett St
- 15 Sullivan Dr
- 422 Dawn Dr Unit 23
- 427 Dawn Dr Unit 15
- 111 Glass St
- 12-14 Church St Unit 12,14
- 307 Dearborn Rd
- 100 Main St Unit M10
- 100 Main St Unit 204
- 15 Main St
- 4 Rodger Rd
- 7 Ferry St
- 9 Pine Acres Rd
- 233 Pembroke St
- 259 Pembroke St
- 1821 Hooksett Rd
- 101 4th Range Rd Unit 4