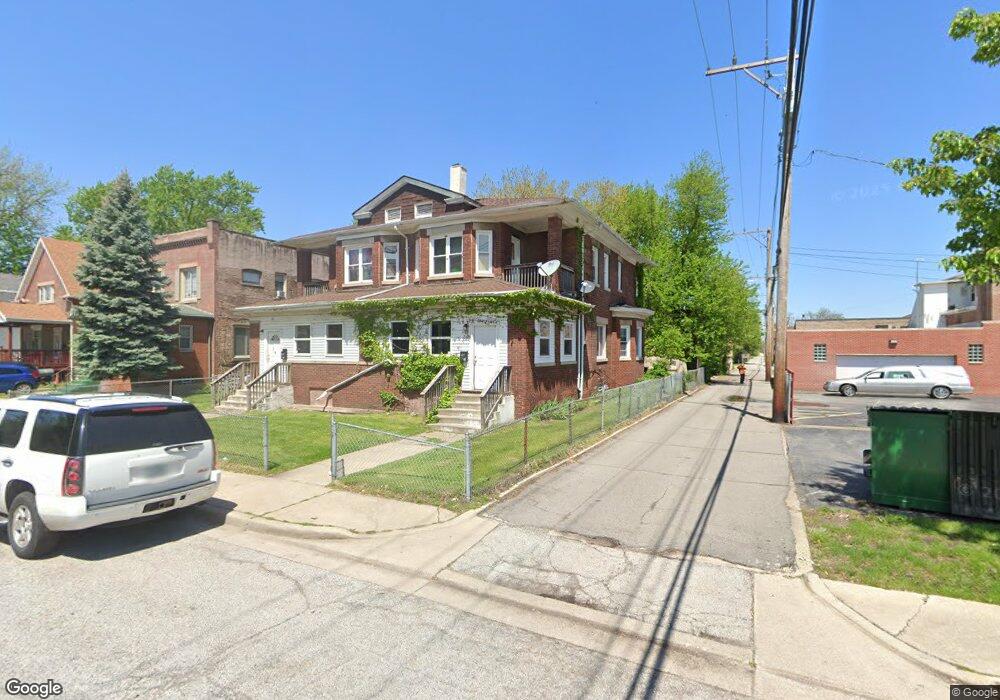
51 Ruth St Hammond, IN 46320
Estimated Value: $203,000 - $333,000
8
Beds
4
Baths
3,460
Sq Ft
$82/Sq Ft
Est. Value
About This Home
This home is located at 51 Ruth St, Hammond, IN 46320 and is currently estimated at $285,423, approximately $82 per square foot. 51 Ruth St is a home located in Lake County with nearby schools including Kenwood Elementary School, Eggers Middle School, and Hammond High School.
Ownership History
Date
Name
Owned For
Owner Type
Purchase Details
Closed on
Sep 17, 2025
Sold by
Gugneja Sandeep
Bought by
Ledesma Mercedes
Current Estimated Value
Home Financials for this Owner
Home Financials are based on the most recent Mortgage that was taken out on this home.
Original Mortgage
$314,204
Outstanding Balance
$314,204
Interest Rate
6.63%
Mortgage Type
FHA
Estimated Equity
-$28,781
Purchase Details
Closed on
Mar 13, 2019
Sold by
51 53 Run Street Land Trust
Bought by
Gugneja Sandeep
Home Financials for this Owner
Home Financials are based on the most recent Mortgage that was taken out on this home.
Original Mortgage
$142,500
Interest Rate
4.4%
Mortgage Type
New Conventional
Purchase Details
Closed on
May 17, 2018
Sold by
Sfs Proierty Groyup Usa Llc
Bought by
5153 Ruth Street Land Trust
Purchase Details
Closed on
Apr 19, 2012
Sold by
Phoenix Investment Holdings 2 Llc
Bought by
Sfs Property Group Usa Llc
Purchase Details
Closed on
Mar 26, 2012
Sold by
Lake County Trust Company
Bought by
Phoenix Investment Holdings 2 Llc
Purchase Details
Closed on
Mar 22, 2012
Sold by
Hansen Stanley E and Hansen Donna J
Bought by
Lake County Trust Company and Trust #6252
Create a Home Valuation Report for This Property
The Home Valuation Report is an in-depth analysis detailing your home's value as well as a comparison with similar homes in the area
Home Values in the Area
Average Home Value in this Area
Purchase History
| Date | Buyer | Sale Price | Title Company |
|---|---|---|---|
| Ledesma Mercedes | -- | Chicago Title Company | |
| Gugneja Sandeep | -- | Meridian Title | |
| 5153 Ruth Street Land Trust | -- | Meridian Title Corp | |
| Sfs Property Group Usa Llc | -- | Meridian Title Corp | |
| Phoenix Investment Holdings 2 Llc | -- | Meridian Title Corp | |
| Lake County Trust Company | -- | Meridian Title Corp |
Source: Public Records
Mortgage History
| Date | Status | Borrower | Loan Amount |
|---|---|---|---|
| Open | Ledesma Mercedes | $314,204 | |
| Previous Owner | Gugneja Sandeep | $142,500 |
Source: Public Records
Tax History
| Year | Tax Paid | Tax Assessment Tax Assessment Total Assessment is a certain percentage of the fair market value that is determined by local assessors to be the total taxable value of land and additions on the property. | Land | Improvement |
|---|---|---|---|---|
| 2025 | $6,344 | $326,400 | $22,600 | $303,800 |
| 2024 | $11,127 | $289,200 | $22,600 | $266,600 |
| 2023 | $5,898 | $232,800 | $24,200 | $208,600 |
| 2022 | $5,898 | $220,100 | $24,200 | $195,900 |
| 2021 | $5,210 | $192,200 | $12,100 | $180,100 |
| 2020 | $5,067 | $185,600 | $12,100 | $173,500 |
| 2019 | $3,824 | $134,900 | $14,100 | $120,800 |
| 2018 | $3,834 | $123,200 | $14,100 | $109,100 |
| 2017 | $4,191 | $117,400 | $14,100 | $103,300 |
| 2016 | $3,455 | $112,100 | $14,100 | $98,000 |
| 2014 | $3,527 | $112,600 | $14,100 | $98,500 |
| 2013 | $3,567 | $120,300 | $14,100 | $106,200 |
Source: Public Records
Map
Nearby Homes
Your Personal Tour Guide
Ask me questions while you tour the home.